. 2024 Jul 28;15(7):536.
doi: 10.1038/s41419-024-06925-x.

Peroxisomal cholesterol metabolism regulates yap-signaling, which maintains intestinal epithelial barrier function and is altered in Crohn's disease

Affiliations

Peroxisomal cholesterol metabolism regulates yap-signaling, which maintains intestinal epithelial barrier function and is altered in Crohn's disease

Marinella Pinelli et al. Cell Death Dis. .

Abstract

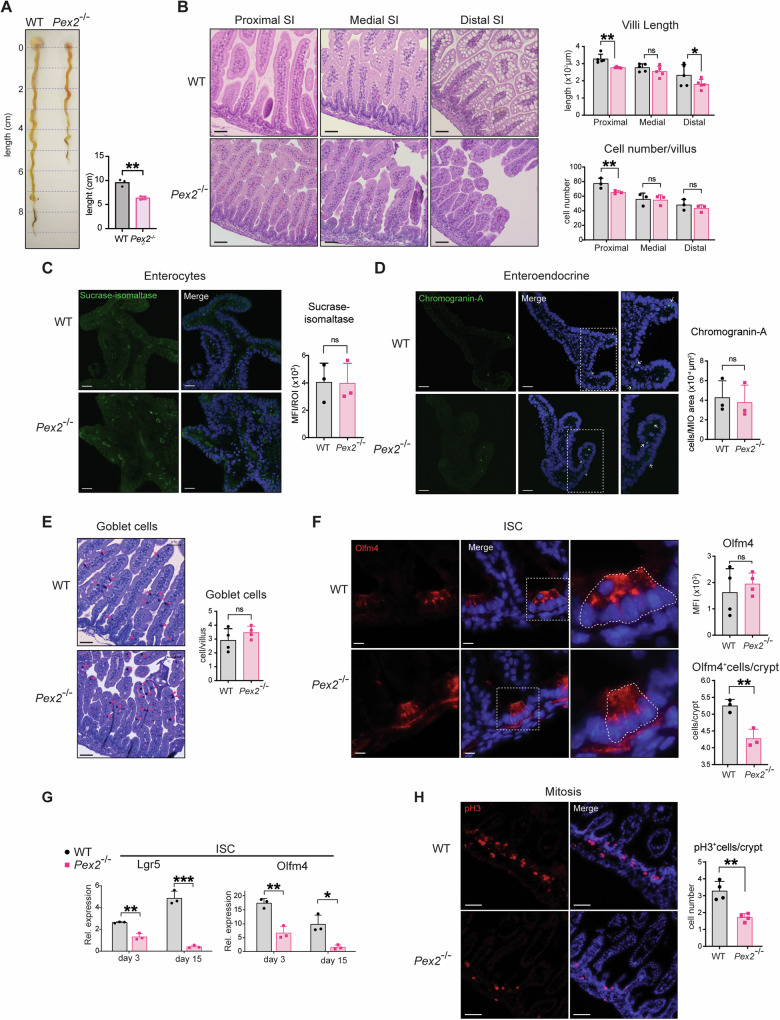
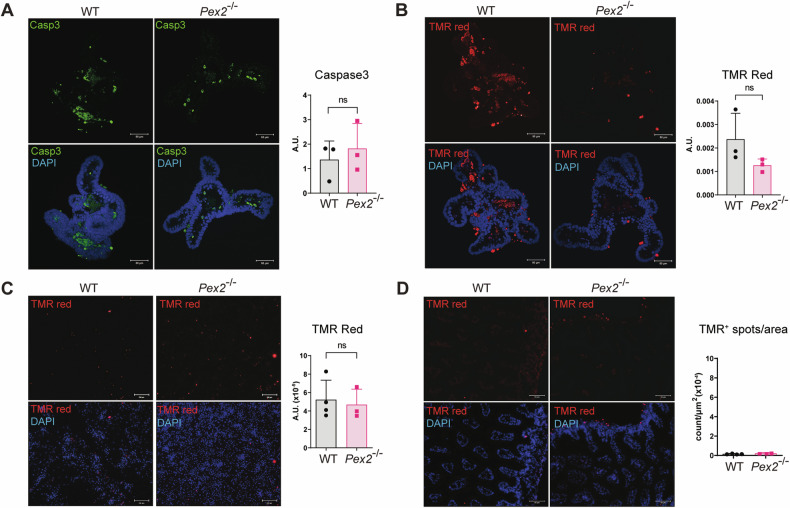
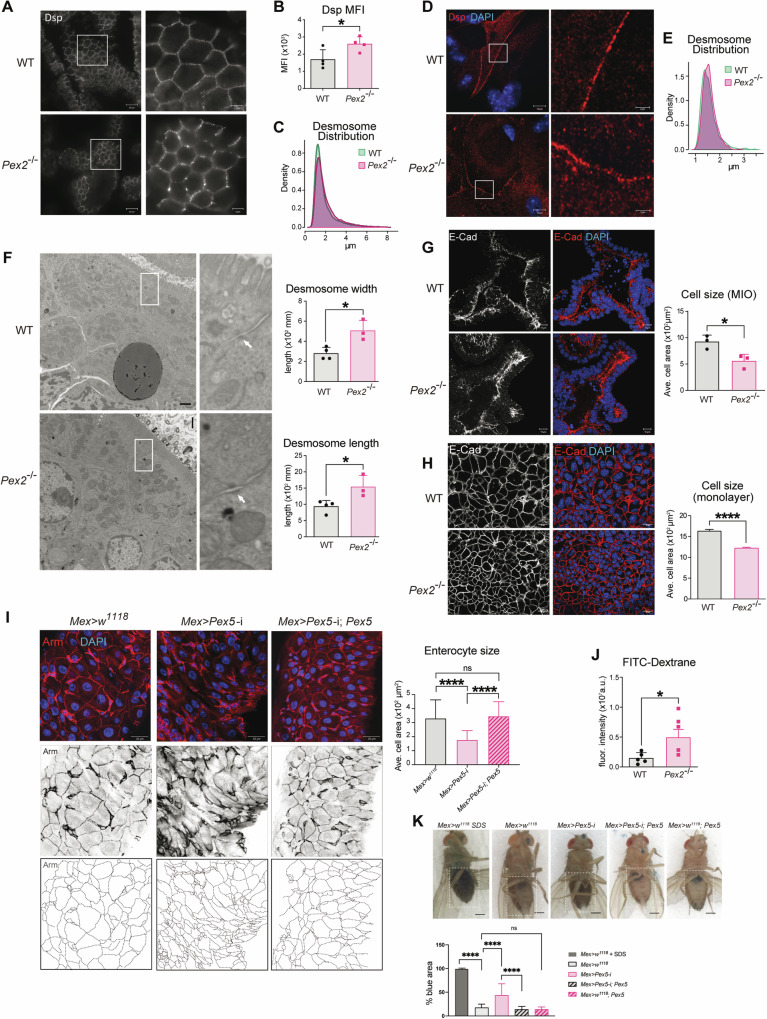
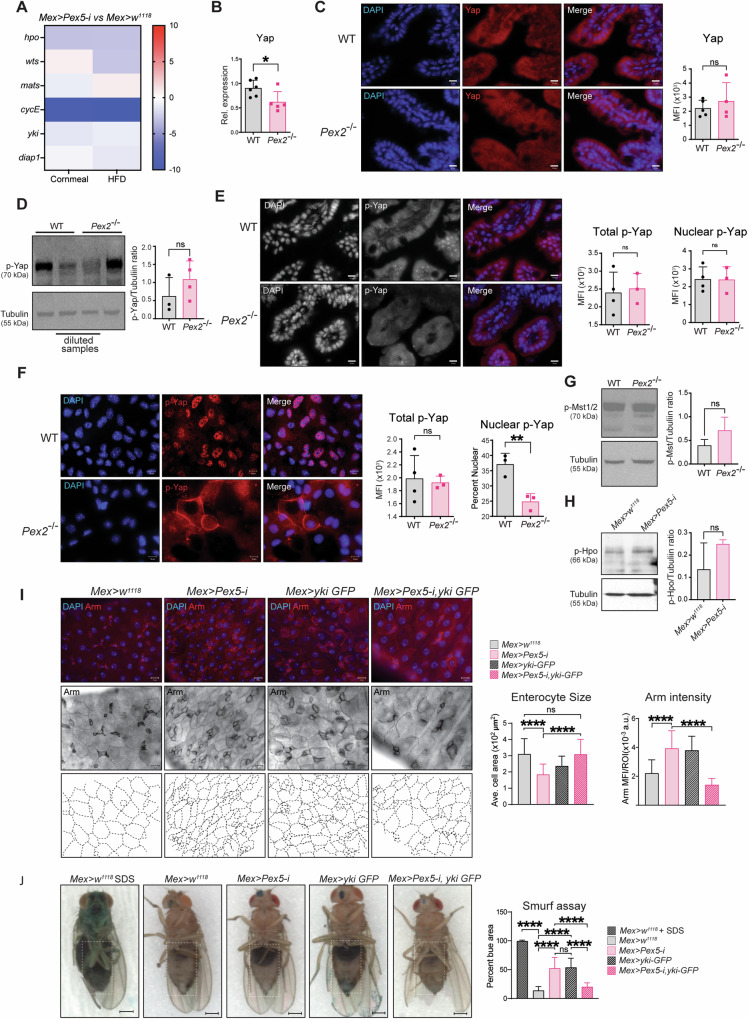
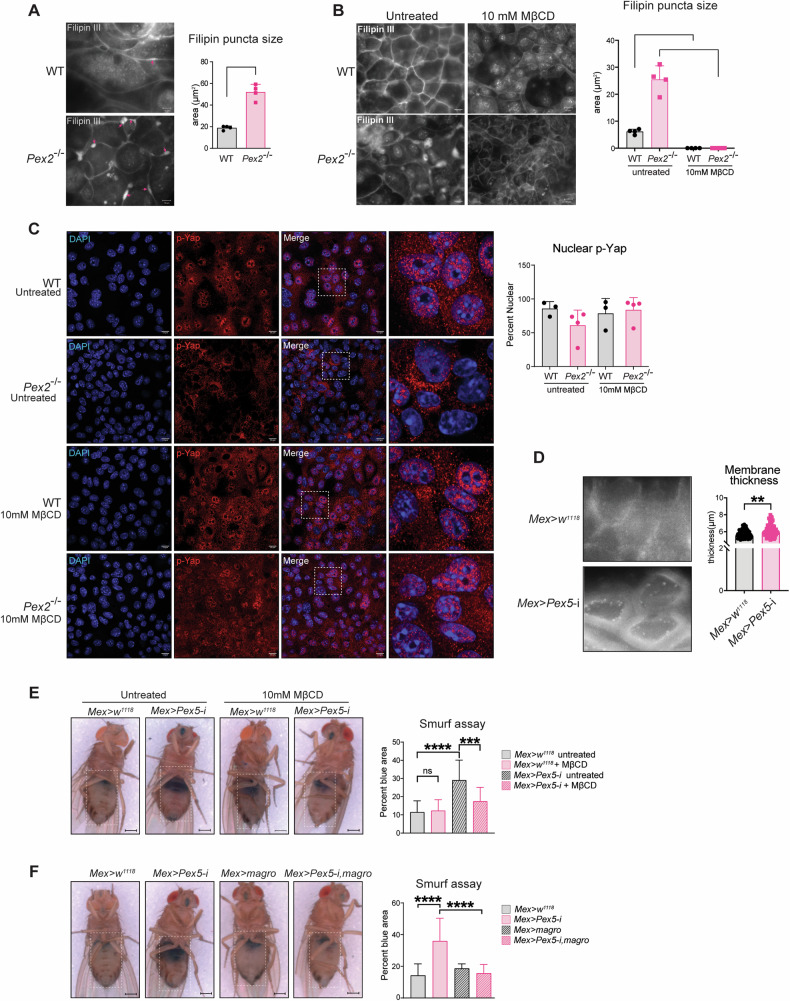
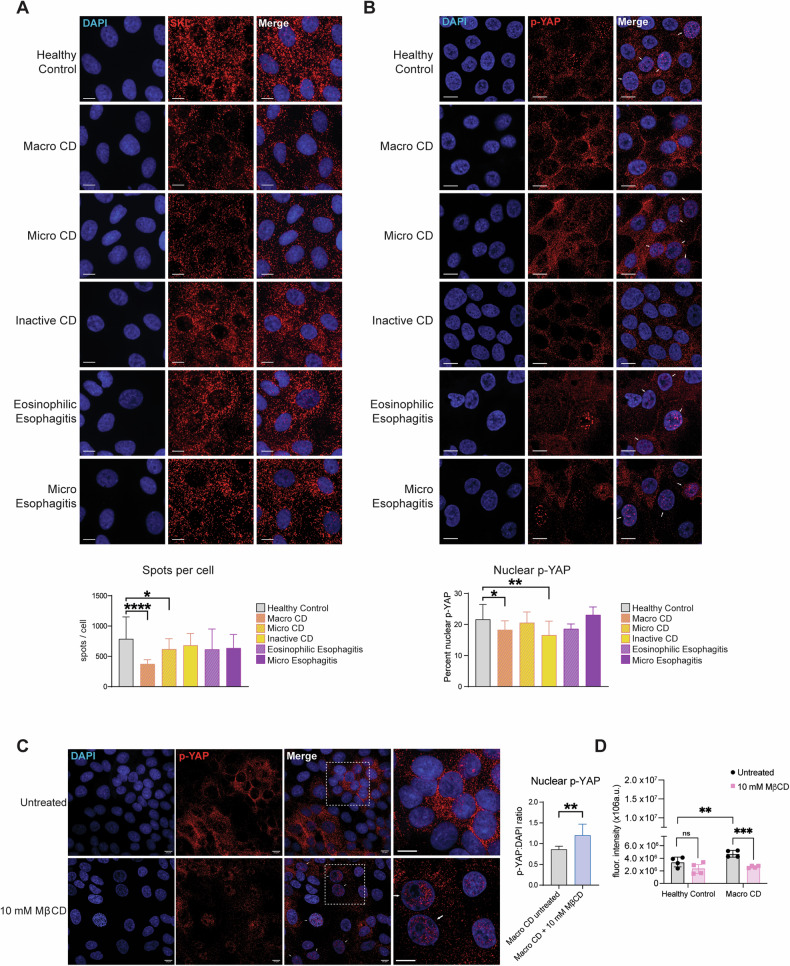
Intestinal epithelial cells line the luminal surface to establish the intestinal barrier, where the cells play essential roles in the digestion of food, absorption of nutrients and water, protection from microbial infections, and maintaining symbiotic interactions with the commensal microbial populations. Maintaining and coordinating all these functions requires tight regulatory signaling, which is essential for intestinal homeostasis and organismal health. Dysfunction of intestinal epithelial cells, indeed, is linked to gastrointestinal disorders such as irritable bowel syndrome, inflammatory bowel disease, and gluten-related enteropathies. Emerging evidence suggests that peroxisome metabolic functions are crucial in maintaining intestinal epithelial cell functions and intestinal epithelium regeneration and, therefore, homeostasis. Here, we investigated the molecular mechanisms by which peroxisome metabolism impacts enteric health using the fruit fly Drosophila melanogaster and murine model organisms and clinical samples. We show that peroxisomes control cellular cholesterol, which in turn regulates the conserved yes-associated protein-signaling and contributes to intestinal epithelial structure and epithelial barrier function. Moreover, analysis of intestinal organoid cultures derived from biopsies of patients affected by Crohn's Disease revealed that the dysregulation of peroxisome number, excessive cellular cholesterol, and inhibition of Yap-signaling are markers of disease and could be novel diagnostic and/or therapeutic targets for treating Crohn's Disease. Our studies provided mechanistic insights on peroxisomal signaling in intestinal epithelial cell functions and identified cholesterol as a novel metabolic regulator of yes-associated protein-signaling in tissue homeostasis.


Conflict of interest statement

The authors declare no competing interests.

Figures

Fig. 1
Fig. 1. Pex2 null allele affects villus length and ISC number in murine small intestines.
A Representative image of dissected guts from WT and Pex2−/− pups at postnatal day 0. The bar graph on the right represents the quantification in cm of the length of the intestinal tract in WT and Pex2−/− pups at day 0. B Images of hematoxylin and eosin staining of small intestine sections from 3 WT and 3 Pex2−/− pups at day 0 pups; the small intestine was divided into three parts roughly corresponding to the duodenum, jejunum, and ileum. Scalebar = 50 µm. We measure the length and cell number/villus of at least 50 villi of 3–5 mice for each genotype. C Representative image of IF microscopy of the enterocyte marker sucrase-isomaltase in MIO. The bar graph on the right represents the quantification of the mean fluorescence intensity (MFI) per organoid region of interest (ROI); n = 30 organoids developed from three mice. Scalebar = 20 µm. D Representative imaging of the enteroendocrine cells marker chromogranin A in MIO. The bar graph on the right reports the quantification of the number of Chromogranin A-positive cells per MIO area; n = 30 organoids developed from three mice. Scalebar = 20 µm. E Imaging of Alcian Blue/PAS (goblet cells) staining of formalin-fixed, paraffin-embedded intestinal tissue sections. Red arrows indicate goblet cells. The histogram reports the number of Alcian Blue/PAS-positive cells per villus; n = 220 villi from four mice for each genotype. F Imaging of Olfm4, a marker for ISC. The histograms report the MFI value per crypt (top) and the number of Olfm4-positive cells per crypt (bottom); n = 30 crypts from three different mice per genotype. Scalebar = 10 µm. G The bar graphs report the relative expression of Lgr5 and Olfm4 transcripts in WT and Pex2−/− MIO at postnatal day 3 and day 15. Organoids were developed from n = 3 mice per genotype. H Imaging of pH3 in small intestine tissue cryosections. The bar graph represents the number of pH3-positive cells per crypt; n = 30 from three mice. scalebar = 50 µm. The error bars in all the graphs show the standard deviation, and significance was determined using Student’s t-test. ***p < 0.001; **p < 0.01; *p < 0.05; ns not significant.
Fig. 2
Fig. 2. Pex2−/− mice do not show increased cell death in the small intestine.
A IF image of active caspase3 in Mio derived from WT and Pex2−/− small intestines. The bar graph represents the Mean Fluorescence Intensity (MFI) on the sum projection of fluorescence per region of interest (ROI). n = 30 organoids from three mice per genotype. Scalebar = 50 µm. B Image of TUNEL-positive cells in Mio derived from WT and Pex2−/− small intestines. The bar graph represents the arbitrary values of red positive-puncta per ROI. n = 30 organoids from three mice per genotype. Scalebar = 50 µm. C Detection of TUNEL-positive cells in MIO-derived monolayers. The bar graph represents the quantification of the number of TUNEL-positive dots in the total area reported in arbitrary units (A.U.). n = 30 monolayers derived from MIO from three mice per genotype. Scalebar = 200 µm. D Detection of TUNEL-positive cells in cryosections of the small intestine from WT and Pex2−/− pups. n = 30 total sections derived from three mice per genotype. Scalebar = 50 µm. In all the graphs, the error bars represent the standard deviation. Significance was determined using Student’s t-test. ns not significant.
Fig. 3
Fig. 3. Intestinal epithelial cells in the Pex2−/− small intestines show defects in desmosome distribution and reduction in cell size.
A IF image of Desmoplakin (Dsp) in small intestine cryosections. n = 40 sections derived from four mice per genotype Scalebar = 20 µm. B The bar graph reports the values of MFI per image in WT and Pex2−/− cryosections. C Desmoplakin puncta distribution is shown as a density plot histogram of the average distance measured in Imaris between the five nearest neighbors. The density plot histogram was created in R, and a Two-sample Kolmogorov-Smirnov test was run: p-value < 2.2e-16. D Imaging of Desmoplakin in WT and Pex2−/−MIO-derived monolayers. n = 40 monolayers derived from four mice per genotype Scalebar = 20 µm. E The average distance between the three nearest neighbors measured in Imaris was reported in a relative density plot histogram. Statistical significance was determined in a two-sample Kolmogorov-Smirnov test: p-value = 1.439e-05. F TEM imaging of small intestine sections from small intestines at day 0 pups, with desmosomes highlighted by the white arrows. Scalebar = 1 µm, 10,000X magnification. The length and thickness of desmosomes were manually measured in ImageJ, n = 3 from three mice per genotype. G Detection of E-cadherin in WT and Pex2−/− MIO. Scalebar = 10 µm. The bar graph represents the cell size reported in μm2. n = 40 from four mice per genotype. H Imaging of E-cadherin in MIO-derived monolayers. n = 30 monolayers derived from three mice per genotype. Scalebar = 20 µm. The bar graph represents the average cell area reported in μm2. I Detection of Armadillo (Arm) in Drosophila intestines dissected from Mex > w1118, Mex>Pex5-i and Mex>Pex5-i; Pex5. n = 10 guts from 10 flies per genotype. The dotted lines in the right panels are enterocyte boundary traces of the above panels to illustrate enterocyte size. Scalebar = 10 µm. The bar graph represents the average cell area reported in μm2. J The bar graph represents the quantification of fluorescence intensity of FITC-dextran in permeability assays of MIO-derived monolayers; n = 5 monolayers. K Representative picture of the Smurf assay on 20-day-old female flies. The dotted lines in the right panels are enterocyte boundary traces of the above panels to illustrate enterocyte size. The bar graph indicates the percentage of dark blue area divided by the total abdomen area; scale bar = 500 µm, n = 20 flies per genotype and condition. In all the bar graphs, the error bars represent the standard deviation. Significance was determined using one-way ANOVA in I and K and Student’s t-test for all the other graphs. ****p < 0.0001; **p < 0.01; *p < 0.05; ns not significant.
Fig. 4
Fig. 4. Yap/Yki signaling is reduced in Pex2−/− and Mex>Pex5-i intestines and affects intestinal epithelial structure and function.
A The heatmap represents the ratio of log2 fold change expression of genes encoding for proteins of the Hippo pathway in Mex>Pex5-i versus control flies as found in the RNA-seq screen on Drosophila intestines dissected from flies raised on regular cornmeal or high-fat diet (HFD). B The bar graph reports the amount of Yap transcript in WT and Pex2−/− small intestines. n = 6 mice per each genotype. C Imaging of Yap in intestinal cryosections. The bar graph represents the MFI of Yap staining per ROI. The values reported were calculated on 10 images per experiment, n = 3 mice. Scalebar = 10 µm. D Western blot analyses of total protein extracts from MIO-derived monolayers to quantify p-YAP protein. The bar graph represents ratiometric analyses of the mean intensity value between p-Yap and α-Tubulin in western blots experiments. n = 3 mice. E IF image of p-Yap in small intestine cryosections. The bar graphs represent the MFI of p-Yap staining per ROI and the ratiometric analyses of the MFI between the p-Yap fluorescent signal and the DAPI fluorescent signal, respectively. The values reported were calculated on 10 images per experiment, n = 3 mice. Scalebar = 10 µm. F Imaging of p-Yap in MIO-derived monolayers. The bar graphs show the MFI of total p-Yap staining per ROI and the ratiometric analyses of the MFI between the p-Yap fluorescent signal and the DAPI fluorescent signal, respectively. The values reported were calculated on 10 images per experiment, n = 3 mice. Scalebar = 10 µm. G Western blot analyses of total protein extracts from MIO-derived monolayers to quantify p-MST1/2. The bar graph represents ratiometric analyses of the mean intensity value between p-Mst1/2 and a-Tubulin in western blots experiments. n = 3 extracts from MIO-derived monolayers from three mice. H Western blotting analyses of total protein extracts from Drosophila intestines of the reported genotypes. The bar graph represents ratiometric analyses of the mean intensity value between p-Hpo and α−Tubulin in western blots experiments. n = 25 guts. I IF image of Armadillo protein to detect progenitor cells (bright cells) and enterocyte boundaries (dim cells) in adult Drosophila guts; n = 12 guts. The dotted lines in the lower panels are enterocyte boundary traces of the above panels to illustrate enterocyte size. The bar graphs show the average cell area of enterocytes in μm2; n = 20 intestines per genotype Scalebar = 10 µm. J Representative picture of 20-days-old female flies of the reported genotypes fed with blue-colored food. The dotted lines in the right panels are enterocyte boundary traces of the above panels to illustrate enterocyte size. The bar graph indicates the percentage of dark blue area relative to the total abdomen area; scale bar = 500 µm, n = 20. In all histograms, the error bars represent standard deviations. Significance was determined using a one-way ANOVA test in I and J and Student’s t-test for all the other graphs. ****p < 0.0001; **p < 0.01; *p < 0.05; ns not significant.
Fig. 5
Fig. 5. Dysfunction of peroxisomal metabolism alters cholesterol distribution in the cells and modifies Yap signaling.
A Imaging of Filipin III staining to visualize cholesterol in WT and Pex2−/− MIO-derived monolayers. The bar graph represents the size of Filipin III puncta (highlighted by the red arrows), n = 40 monolayers derived from four mice per genotype. Scalebar = 10 µm. B Immunofluorescence with Filipin III in WT and Pex2−/− MIO-derived monolayer untreated and treated with 10 mM MβCD for 2 h. The bar graph represents the size of cholesterol puncta, n = 40 monolayers images derived from four established monolayers from four mice per genotype. Scalebar = 10 µm. C IF image of p-Yap in MIO-derived monolayer, untreated and treated with 10 mM MβCD for 2 h; The bar graph reports the percentage of p-Yap fluorescent signal that overlaps with the DAPI fluorescent signal. n = 30 monolayers derived from three established monolayers from three mice per genotype. D Imaging of FIlipin III staining in and Mex > w1118 and Mex>Pex5-i enterocytes; n = 20 intestines per genotype. Scalebar = 10 µm. E Representative pictures of Mex > w1118 and Mex>Pex5-i flies fed a regular cornmeal diet or a diet supplemented with 10 mM MβCD for 48 h before being tested in a Smurf assay. Scalebar = 500 µm. The dotted lines in the right panels are enterocyte boundary traces of the above panels to illustrate enterocyte size. The bar graph indicates the percentage of dark blue area relative to the total abdomen area; n = 20 guts per genotype and condition. F Representative pictures of flies of the reported genotypes tested in the Smurf assay. The dotted lines in the right panels are enterocyte boundary traces of the above panels to illustrate enterocyte size. The bar graph indicates the percentage of dark blue area in the total abdomen area; n = 20 guts per genotype. Scalebar = 500 µm. In all histograms, the error bars represent standard deviations. Significance was determined using Student’s t-test in A and D and a two-way ANOVA test for all the other graphs. ****p < 0.0001; ***p < 0.001; **p < 0.01; ns not significant.
Fig. 6
Fig. 6. HIO-derived monolayers from IBD patients show peroxisome cholesterol-dependent recruitment of p-YAP out of the nuclei.
A Detection of peroxisomes SKL staining in HIO-derived monolayers for the detection of peroxisomes. For patient samples n = 10 monolayers. For healthy controls, n = 30. Scalebar = 10 µm. The bar graph reports the number of SKL-positive spots per cell in each sample. B Detection of p-YAP in HIO-derived monolayers. For patient samples, n = 10. For healthy controls, n = 30. Scalebar = 10 µm. The bar graph reports the percentage of the p-YAP fluorescent signal overlapping with the DAPI fluorescent signal. C p-YAP staining in HIO-derived monolayer from the patient with macroscopic Crohn’s disease, with and without treatment with 10 mM MβCD for 2 h. Scalebar = 10 µm. The bar graph reports the amount of p-YAP fluorescent signal that overlaps with the DAPI fluorescent signal. D The bar graph represents the quantification of fluorescence intensity of FITC-dextran in permeability assays of HIO-derived monolayers; n = 4 monolayers from four patients and four healthy control intestinal biopsies. In all histograms, the error bars represent standard deviations. Significance was determined using one-way ANOVA in A and B and Student’s t-test in C. ****p < 0.0001; **p < 0.01; *p < 0.05; ns not significant.

Similar articles

Cited by

References

    1. Sartor RB. Mechanisms of disease: pathogenesis of Crohn’s disease and ulcerative colitis. Nat Clin Pr Gastroenterol Hepatol. 2006;3:390–407.10.1038/ncpgasthep0528 - DOI - PubMed
    1. Potten CS, Kellett M, Rew DA, Roberts SA. Proliferation in human gastrointestinal epithelium using bromodeoxyuridine in vivo: data for different sites, proximity to a tumour, and polyposis coli. Gut. 1992;33:524–9. 10.1136/gut.33.4.524 - DOI - PMC - PubMed
    1. Cheng H. Origin, differentiation and renewal of the four main epithelial cell types in the mouse small intestine. IV. Paneth cells. Am J Anat. 1974;141:521–35. 10.1002/aja.1001410406 - DOI - PubMed
    1. Ritsma L, Ellenbroek SIJ, Zomer A, Snippert HJ, de Sauvage FJ, Simons BD, et al. Intestinal crypt homeostasis revealed at single-stem-cell level by in vivo live imaging. Nature. 2014;507:362–5. 10.1038/nature12972 - DOI - PMC - PubMed
    1. Peterson LW, Artis D. Intestinal epithelial cells: regulators of barrier function and immune homeostasis. Nat Rev Immunol. 2014;14:141–53. 10.1038/nri3608 - DOI - PubMed