. 2024 Jul 29;22(1):301.
doi: 10.1186/s12916-024-03513-w.

Unveiling the epigenetic impact of vegan vs. omnivorous diets on aging: insights from the Twins Nutrition Study (TwiNS)

Affiliations

Unveiling the epigenetic impact of vegan vs. omnivorous diets on aging: insights from the Twins Nutrition Study (TwiNS)

Varun B Dwaraka et al. BMC Med. .

Abstract

Background: Geroscience focuses on interventions to mitigate molecular changes associated with aging. Lifestyle modifications, medications, and social factors influence the aging process, yet the complex molecular mechanisms require an in-depth exploration of the epigenetic landscape. The specific epigenetic clock and predictor effects of a vegan diet, compared to an omnivorous diet, remain underexplored despite potential impacts on aging-related outcomes.

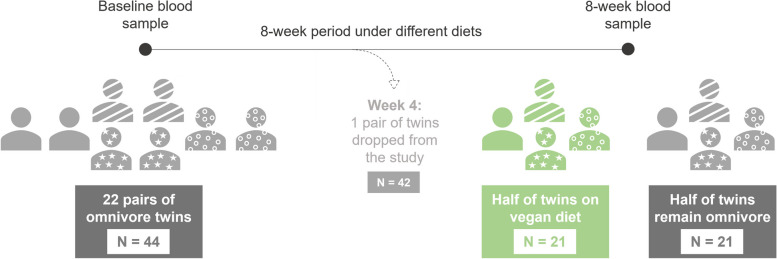
Methods: This study examined the impact of an entirely plant-based or healthy omnivorous diet over 8 weeks on blood DNA methylation in paired twins. Various measures of epigenetic age acceleration (PC GrimAge, PC PhenoAge, DunedinPACE) were assessed, along with system-specific effects (Inflammation, Heart, Hormone, Liver, and Metabolic). Methylation surrogates of clinical, metabolite, and protein markers were analyzed to observe diet-specific shifts.

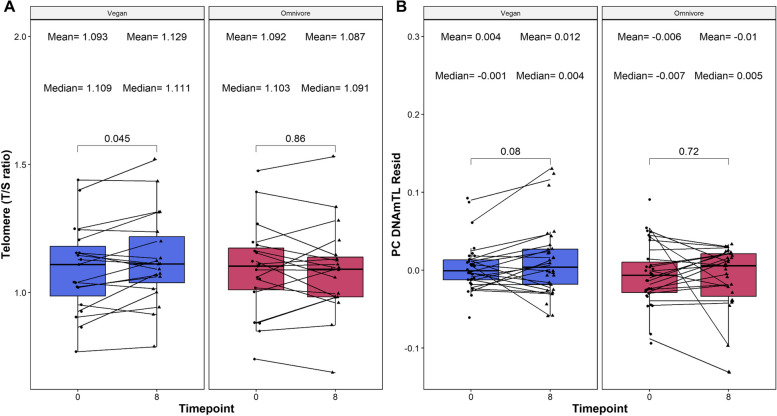
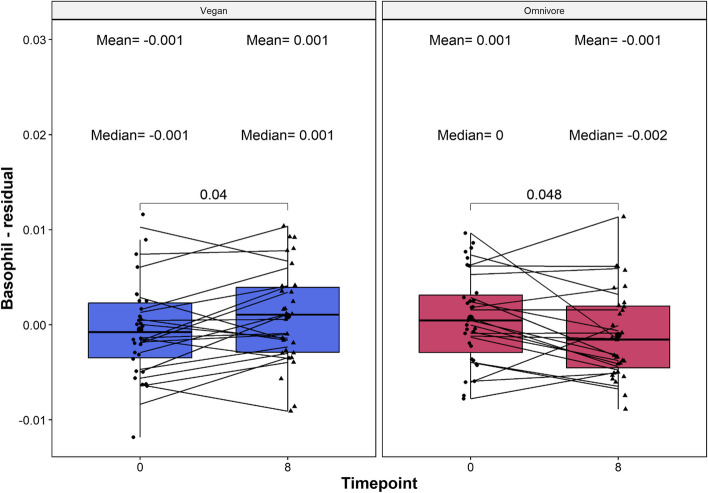
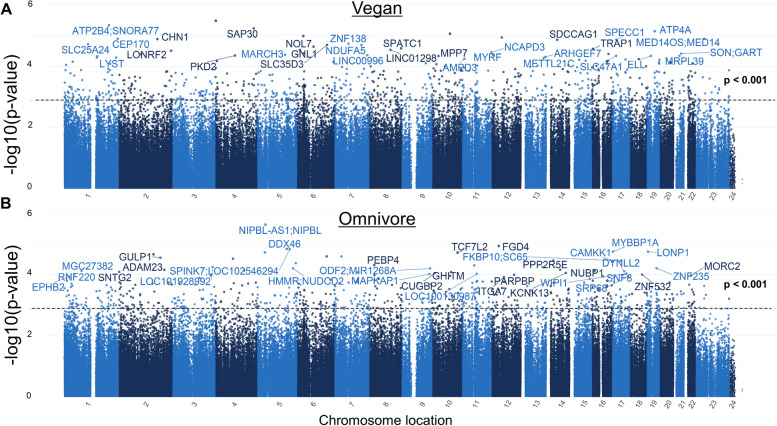
Results: Distinct responses were observed, with the vegan cohort exhibiting significant decreases in overall epigenetic age acceleration, aligning with anti-aging effects of plant-based diets. Diet-specific shifts were noted in the analysis of methylation surrogates, demonstrating the influence of diet on complex trait prediction through DNA methylation markers. An epigenome-wide analysis revealed differentially methylated loci specific to each diet, providing insights into the affected pathways.

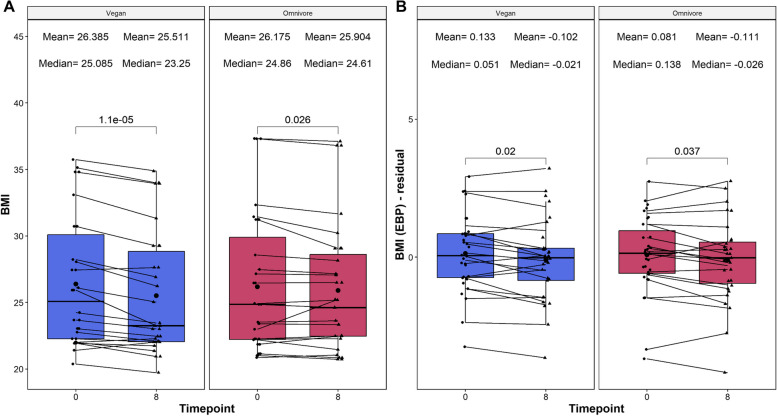
Conclusions: This study suggests that a short-term vegan diet is associated with epigenetic age benefits and reduced calorie intake. The use of epigenetic biomarker proxies (EBPs) highlights their potential for assessing dietary impacts and facilitating personalized nutrition strategies for healthy aging. Future research should explore the long-term effects of vegan diets on epigenetic health and overall well-being, considering the importance of proper nutrient supplementation.

Trial registration: Clinicaltrials.gov identifier: NCT05297825.

Keywords: Aging; Diet and Nutrition; Epigenetic clocks; Epigenome-wide association study; Omnivore; Vegan.


Conflict of interest statement

Dr. Dwaraka, Dr. Carreras-Gallo, Aaron Lin, Logan Turner, Dr. Mendez, Hannah Went, and Ryan Smith are all employees of TruDiagnostic Inc. Dr Gardner reported receiving funding from Beyond Meat outside of the submitted work. Dr J. L. Sonnenburg is a Chan Zuckerberg Biohub investigator. No other disclosures were reported.

Figures

Fig. 1
Fig. 1
Timeline diagram for the study design. A total of 21 pairs of twins (N=42) were subjected to a vegan diet (N = 21, labeled in green) and an omnivore diet (N = 21, labeled in orange). Blood was collected for baseline at the start of the trial (week 0) and at the end of the trial (week 8) and methylation states were quantified using the EPIC 850k array
Fig. 2
Fig. 2
Boxplot showing the evolution of epigenetic age acceleration (EAA)/residuals among the significant epigenetic age clocks and systems-specific clocks based on diet type. Clocks assessed include the A PC GrimAge, B PC PhenoAge, C DunedinPACE, D Systems Age, E Inflammation Age, F Heart Age, G Liver Age, H Metabolic Age, and I Musculoskeletal Age. On the X-axis, the time points of measurements in weeks. On the Y-axis, the EAA/residual measure. EAA, or residual, is defined as the residual calculated between the raw value regressed upon chronological age, and adjusted by sex, technical principal components 1 and 2. On the top, the mean and median values of the EAA at each time point. The p-values of the paired Wilcoxon-rank sums test are also displayed in the plots. Lines that connect both boxplots represent the average of each patient’s tests
Fig. 3
Fig. 3
Boxplot showing the change between relative telomere levels as quantified by qPCR and DNA methylation (PC DNAmTL). Telomere qPCR value is reported in panel A, while the PC DNAmTL values are reported in B. On the X-axis, the time points of measurements in weeks. On the Y-axis, the T/S ratio is shown for qPCR, or the residual of PC DNAmTL. The PC DNAmTL residual is defined as the residual calculated between the raw PC DNAmTL value regressed upon chronological age, and adjusted by sex, technical principal components 1 and 2. On the top, the mean and medians of the Y-axis values at each time point are reported. The p-values of the paired Wilcoxon-rank sums test are also displayed in the plots. Lines that connect both boxplots represent the average of each patient’s tests
Fig. 4
Fig. 4
Boxplots showing the evolution of basophil cell subset percentages based on diet type. On the X-axis, the time points of measurements in weeks. On the Y-axis, the basophil measure. The basophil measure is residualized, which is defined as the residual of the raw deconvolution value regressed upon chronological age, and adjusted by sex, technical principal components 1 and 2. On the top, the mean and median values of the residual at each time point. The p-values of the paired Wilcoxon-rank sums test are also displayed in the plots. Lines that connect both boxplots represent the average of each patient’s tests
Fig. 5
Fig. 5
Boxplots showing the relative beta value change of two weight loss methylation sites on the ABCG1 gene (reported on the left) and PHOSPHO1 gene (reported on the right). On the X-axis, the time points of measurements in weeks, and the loci beta value which is reported on the Y-axis. On the top, the mean and median beta values of the loci at each time point. The p-values of the paired Wilcoxon-rank sums test are also displayed in the plots. Lines that are connecting both boxplots represent the average of each patient’s tests
Fig. 6
Fig. 6
Boxplot showing the evolution of BMI values calculated from clinical measures (reported on the left) and epigenetic biomarker proxy (EBP) measures (reported on the right). On the X-axis, the time points of measurements in weeks. On the Y-axis, the BMI measure. The BMI-EBP measurements are reported as residuals, which are defined as the residual of the raw BMI value regressed upon chronological age, and adjusted by sex, technical principal components 1 and 2. No residual calculation was done for the clinical EBP. On the top, the mean and median values of the BMI at each time point. The p-values of the paired Wilcoxon-rank sums test are also displayed in the plots. Lines that connect both boxplots represent the average of each patient’s tests
Fig. 7
Fig. 7
Manhattan plots for the vegan and the omnivore epigenome-wide association studies. The Manhattan plot illustrates genes associated with CpG sites identified in the A vegan and B omnivore comparison, with each dot representing a CpG site and its vertical position corresponding to the negative logarithm (base 10) of the unadjusted p-value for DNA methylation association (significance set at p = 0.001). The x-axis denotes genomic positions organized by chromosomes, with color-coded dots indicating specific chromosomes, and prominently peaked dots represent significantly associated CpG sites surpassing the genome-wide significance threshold
Fig. 8
Fig. 8
Volcano plot of DMLs identified in the comparison between vegan and omnivore diet at the week 8 time point. The volcano plot illustrates DMLs identified in the Vegan vs. Omnivore comparison, with each dot representing a CpG site and its vertical position corresponding to the negative logarithm (base 10) of the unadjusted p-value for DNA methylation association. The x-axis denotes the relative log fold change (logFC) of the m-values between the vegan and the omnivore diets. Values greater than 0 represent CpGs with greater methylation among vegans (blue), compared to the negative values which represent greater methylation among omnivores (red)

References

    1. Jin K, Simpkins JW, Ji X, Leis M, Stambler I. The critical need to promote research of aging and aging-related diseases to improve health and longevity of the elderly population. Aging Dis. 2014;6(1):1–5. - PMC - PubMed
    1. Bauman A, Merom D, Bull FC, Buchner DM, Fiatarone Singh MA. Updating the evidence for physical activity: summative reviews of the epidemiological evidence, prevalence, and interventions to promote “active aging.” Gerontologist. 2016;56(Suppl 2):S268-280. 10.1093/geront/gnw031 - DOI - PubMed
    1. Kennedy BK, Berger SL, Brunet A, Campisi J, Cuervo AM, Epel ES, et al. Aging: a common driver of chronic diseases and a target for novel interventions. Cell. 2014;159(4):709–13. 10.1016/j.cell.2014.10.039 - DOI - PMC - PubMed
    1. Campisi J, Kapahi P, Lithgow GJ, Melov S, Newman JC, Verdin E. From discoveries in ageing research to therapeutics for healthy ageing. Nature. 2019;571(7764):183–92. 10.1038/s41586-019-1365-2 - DOI - PMC - PubMed
    1. Sen P, Shah PP, Nativio R, Berger SL. Epigenetic mechanisms regulating longevity and aging. Cell. 2016;166(4):822–39. 10.1016/j.cell.2016.07.050 - DOI - PMC - PubMed

Publication types

Associated data