. 2024 Apr 29;4(4):347-362.
doi: 10.1021/acsphyschemau.3c00073. eCollection 2024 Jul 24.

Rational Design of Far-Red Archaerhodopsin-3-Based Fluorescent Genetically Encoded Voltage Indicators: from Elucidation of the Fluorescence Mechanism in Archers to Novel Red-Shifted Variants

Affiliations

Rational Design of Far-Red Archaerhodopsin-3-Based Fluorescent Genetically Encoded Voltage Indicators: from Elucidation of the Fluorescence Mechanism in Archers to Novel Red-Shifted Variants

Dmitrii M Nikolaev et al. ACS Phys Chem Au. .

Abstract

Genetically encoded voltage indicators (GEVIs) have found wide applications as molecular tools for visualization of changes in cell membrane potential. Among others, several classes of archaerhodopsin-3-based GEVIs have been developed and have proved themselves promising in various molecular imaging studies. To expand the application range for this type of GEVIs, new variants with absorption band maxima shifted toward the first biological window and enhanced fluorescence signal are required. Here, we integrate computational and experimental strategies to reveal structural factors that distinguish far-red bright archaerhodopsin-3-based GEVIs, Archers, obtained by directed evolution in a previous study (McIsaac et al., PNAS, 2014) and the wild-type archaerhodopsin-3 with an extremely dim fluorescence signal, aiming to use the obtained information in subsequent rational design. We found that the fluorescence can be enhanced by stabilization of a certain conformation of the protein, which, in turn, can be achieved by tuning the pK a value of two titratable residues. These findings were supported further by introducing mutations into wild-type archeorhodopsin-3 and detecting the enhancement of the fluorescence signal. Finally, we came up with a rational design and proposed previously unknown Archers variants with red-shifted absorption bands (λmax up to 640 nm) and potential-dependent bright fluorescence (quantum yield up to 0.97%).


Conflict of interest statement

The authors declare no competing financial interest.

Figures
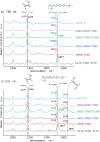
Figure 1
Figure 1
Resonance Raman spectra of the wild-type Arch and its bright variants. Purified samples were solubilized in 10 mM Tris, 200 mM NaCl, 0.15% DM, pH = 6.5. Raman spectra were recorded with excitation at 785 nm [dark-adapted spectrum, (a)] and 532 nm [light-adapted spectrum, (b)]. The laser power was set to 100 mW. Arch-5 denotes Arch V59A/P60L/D95E/T99C/P196S.
Figure 2
Figure 2
(a) Photocycle of the wild-type Arch. (b) Structures of the counterion region and the proton release group region in the G- and O-states of the wild-type Arch obtained from the corresponding QM/MM models. In the G-state, three water molecules are observed in the vicinity of D95 and D222 counterions. The D222 counterion is deprotontated, and it forms hydrogen bonds with Y67, Y195, W96, and two water molecules (upper left panel). E214 from the proton release group is protonated and forms a hydrogen bond with E207. The positively charged R92 is oriented toward T215 (lower left panel). In the O-state, only a single water molecule is observed in the vicinity of the counterions. D222 forms three hydrogen bonds with Y195, W96, and one water molecule located outside the counterion region (upper right panel). E214 is deprotonated, and E207 forms a hydrogen bond with Y93. The positively charged R92 is oriented toward negatively charged E214 and E207, giving space for the formation of a water chain between E214 and D222 (lower right panel).
Figure 3
Figure 3
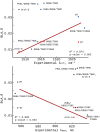
Bond length alternation of the chromophore (QM/MM models) versus experimental ethylenic stretch band maxima (λC=C, upper diagram) and absorption band maxima (λmax, lower diagram). Blue and red dots correspond to BLA values obtained from the G- and O-state QM/MM models, respectively. The data were fitted by the least-squares method (the red lines). Arch-5 denotes Arch V59A/P60L/D95E/T99C/P196S.
Figure 4
Figure 4
Cluster models employed to calculate the C=N Schiff base stretch mode vibration frequencies in the G- and O-states of the wild-type Arch. (a) Model for the G-state included the chromophore with K226 residue, D95, D222, and three water molecules. (b) Model for the O-state included the chromophore with K226 residue, D95, D222, and the single water molecule.
Figure 5
Figure 5
UV–vis absorption spectra of the wild-type Arch and its bright variants. Purified samples were solubilized in 10 mM Tris, 200 mM NaCl, 0.15% DM, pH = 6.5. The result of decomposition of the Arch D95E/T99C/P196S absorption band into two Gaussian functions is depicted as dotted lines.
Figure 6
Figure 6
Ethylenic stretch band maxima of Raman spectra (λC=C) versus absorption band maxima of UV–vis spectra (λmax) for microbial rhodopsins. Wild-type microbial rhodopsins are shown as blue dots. O photocycle intermediates of microbial rhodopsins and the blue form of bacteriorhodopsin are shown as red dots. Archers are shown as green dots. Abbreviations: KR2, Krokinobacter rhodopsin 2; NR, Neurospora rhodopsin; PspR, Pseudomonas putida rhodopsin; IaNaR, Indibacter alkaliphilus rhodopsin; GR, Gloeobacter rhodopsin; LR, Leptosphaeria rhodopsin; Arch, archaerhodopsin-3; XR, Xanthorhodopsin; bR, light-adapted Halobacterium salinarum bacteriorhodopsin; BluebR, the blue form of bR at pH = 2.6; OKR2, the O intermediate of KR2 photocycle; OHsHR, the O intermediate of Halobacterium salinarum halorhodopsin photocycle; ObR, the O intermediate of bR photocycle; Arch-5, Arch V59A/P60L/D95E/T99C/P196S.
Figure 7
Figure 7
Absorption, excitation, and fluorescence emission spectra of Arch D95E/T99C (a) and Arch D95E/T99C/P196S (b). Purified samples were solubilized in 0.1% DM, 0.05 M Tris, 0.3 M NaCl, pH = 6.5. Excitation spectra were obtained with λem = 740 nm. Fluorescence emission spectra were obtained with λexc = 630 nm.
Figure 8
Figure 8
Structures of the counterion region and the proton release group region in the G- and O-states of the Arch D95E/T99C obtained from the corresponding QM/MM models. In the G-state, only a single water molecule is observed in the vicinity of E95 and D222 counterions. The D222 counterion is deprotonated, and it forms hydrogen bonds with Y67, Y195, and the water molecule from the counterion region (upper left panel). E214 from the proton release group is protonated and forms a hydrogen bond with E207. The positively charged R92 is oriented toward T215 (lower left panel). In the O-state, also only one water molecule is observed in the vicinity of the counterions. D222 forms two hydrogen bonds with Y195 and one water molecule located outside the counterion region (upper right panel). E214 is deprotonated, and E207 forms a hydrogen bond with Y93. The positively charged R92 is oriented toward negatively charged E214 and E207, giving space for the formation of a water chain between E214 and D222 (lower right panel).
Figure 9
Figure 9
Absorption, excitation, and fluorescence emission spectra of Arch Y195F. The purified sample was solubilized in 10 mM Tris, 200 mM NaCl, 0.15% DM, pH = 6.5. An excitation spectrum was obtained with λem = 740 nm. A fluorescence emission spectrum was obtained with λexc = 630 nm.
Figure 10
Figure 10
(a) Absorbance spectrum of purified Arch W96F/T215A solubilized in 10 mM Tris, 200 mM NaCl, 0.15% DM at pH = 6.5. The absorbance spectrum is fitted by two Gaussian functions attributed to the G-form and O-form of the protein. (b) Absorbance, fluorescence excitation, fluorescence emission spectral bands of Arch W96F/T215A recorded in 10 mM Tris, 200 mM NaCl, 0.15% DM at pH = 6.5.
Figure 11
Figure 11
Fluorescence voltage sensitivity of Arch-based GEVIs measured as the relative change of fluorescence intensity on the 100 mV voltage change vs experimentally measured pKa(PSB).
Figure 12
Figure 12
Absorption, excitation, and fluorescence emission spectra of Arch D95E/T99C/P196S/T215A (a) and Arch D95E/T99C/T215A/A225 M (b). Purified samples were solubilized in 0.1% DM, 0.05 M Tris, 0.3 M NaCl, pH = 6.5. Excitation spectra were obtained with λem = 740 nm. Fluorescence emission spectra were obtained with λexc = 630 nm.

Similar articles

Cited by

References

    1. Lin M. Z.; Schnitzer M. J. Genetically encoded indicators of neuronal activity. Nat. Neurosci. 2016, 19, 1142–1153. 10.1038/nn.4359. - DOI - PMC - PubMed
    1. Shen Y.; Nasu Y.; Shkolnikov I.; Kim A.; Campbell R. E. Engineering genetically encoded fluorescent indicators for imaging of neuronal activity: Progress and prospects. Neurosci. Res. 2020, 152, 3–14. 10.1016/j.neures.2020.01.011. - DOI - PubMed
    1. Azimi Hashemi N.; Bergs A. C.; Schüler C.; Scheiwe A. R.; Steuer Costa W.; Bach M.; Liewald J. F.; Gottschalk A. Rhodopsin-based voltage imaging tools for use in muscles and neurons of Caenorhabditis elegans. Proc. Natl. Acad. Sci. U.S.A. 2019, 116, 17051–17060. 10.1073/pnas.1902443116. - DOI - PMC - PubMed
    1. Xu Y.; Zou P.; Cohen A. E. Voltage imaging with genetically encoded indicators. Curr. Opin. Chem. Biol. 2017, 39, 1–10. 10.1016/j.cbpa.2017.04.005. - DOI - PMC - PubMed
    1. Nikolaev D. M.; Mironov V. N.; Shtyrov A. A.; Kvashnin I. D.; Mereshchenko A. S.; Vasin A. V.; Panov M. S.; Ryazantsev M. N. Fluorescence Imaging of Cell Membrane Potential: From Relative Changes to Absolute Values. Int. J. Mol. Sci. 2023, 24, 2435.10.3390/ijms24032435. - DOI - PMC - PubMed

LinkOut - more resources