. 2024 May 17;10(7):1318-1331.
doi: 10.1021/acscentsci.4c00286. eCollection 2024 Jul 24.

DCAF16-Based Covalent Handle for the Rational Design of Monovalent Degraders

Affiliations

DCAF16-Based Covalent Handle for the Rational Design of Monovalent Degraders

Melissa Lim et al. ACS Cent Sci. .

Abstract

Targeted protein degradation with monovalent molecular glue degraders is a powerful therapeutic modality for eliminating disease causing proteins. However, rational design of molecular glue degraders remains challenging. In this study, we sought to identify a transplantable and linker-less covalent handle that could be appended onto the exit vector of various protein-targeting ligands to induce the degradation of their respective targets. Using the BET family inhibitor JQ1 as a testbed, we synthesized and screened a series of covalent JQ1 analogs and identified a vinylsulfonyl piperazine handle that led to the potent and selective degradation of BRD4 in cells. Through chemoproteomic profiling, we identified DCAF16 as the E3 ligase responsible for BRD4 degradation-an E3 ligase substrate receptor that has been previously covalently targeted for molecular glue-based degradation of BRD4. Interestingly, we demonstrated that this covalent handle can be transplanted across a diverse array of protein-targeting ligands spanning many different protein classes to induce the degradation of CDK4, the androgen receptor, BTK, SMARCA2/4, and BCR-ABL/c-ABL. Our study reveals a DCAF16-based covalent degradative and linker-less chemical handle that can be attached to protein-targeting ligands to induce the degradation of several different classes of protein targets.


Conflict of interest statement

The authors declare the following competing financial interest(s): ACK and JWP are employees of Novartis BioMedical Research. This study was funded by Novartis BioMedical Research and the Novartis-Berkeley Translational Chemical Biology Institute. DKN is a co-founder, shareholder, and scientific advisory board member for Frontier Medicines and Vicinitas Therapeutics. DKN is a member of the board of directors for Vicinitas Therapeutics. DKN is also on the scientific advisory board of The Mark Foundation for Cancer Research, Photys Therapeutics, Apertor Pharmaceuticals, Oerth Bio, and Deciphera Pharmaceuticals. DKN is also an Investment Advisory Partner for a16z Bio+Health, an Advisory Board member for Droia Ventures, and an iPartner at The Column Group.

Figures

Figure 1
Figure 1
Identifying covalent handles that enable the degradation of BRD4. (a) Series of analogs of the BET family inhibitor JQ1 bearing various electrophilic handles. (b) Testing for BRD4 degradation with covalent JQ1 derivatives. HEK293T cells were treated with DMSO vehicle or covalent JQ1 derivatives (10 μM) for 24 h and BRD4 long and short isoforms and GAPDH loading control levels were assessed by Western blotting. Shown are gels that are representative of n = 3 biologically independent replicates per group. (c) Quantitation of BRD4 long and short isoforms from experiment described in (b) showing individual replicate values and average ± sem. Significance is expressed as *p < 0.001 compared to vehicle-treated controls.
Figure 2
Figure 2
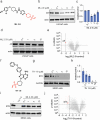
Characterization of the monovalent and covalent BRD4 degrader ML 1–50. (a) Structure of ML 1–50 with the vinylsulfonyl piperazine covalent chemical handle in red. (b, c) Dose–response of BRD4 degradation. HEK293T cells were treated with DMSO vehicle or ML 1–50 for 24 h. BRD4 and actin loading control levels were assessed by Western blotting and quantified in (c). (d, e) Proteasome inhibitor attenuation of BRD4 degradation. HEK293T cells were pretreated with DMSO vehicle or bortezomib (1 μM) 1 h prior to DMSO vehicle or ML 1–50 (1 μM) treatment for 24 h. BRD4 and actin loading control levels were assessed by Western blotting and quantified in (e). (f, g) NEDD8 activating enzyme inhibitor attenuation of BRD4 degradation. HEK293T cells were pretreated with DMSO vehicle or MLN4924 (1 μM) 1 h prior to DMSO vehicle or ML 1–50 (1 μM) treatment for 24 h. BRD4 and actin loading control levels were assessed by Western blotting and quantified in (g). (h) BRD4 degradation in MDA-MB-231 cells. MDA-MB-231 cells were treated with DMSO vehicle or ML 1–50 for 24 h and BRD4 and actin loading control levels were assessed by Western blotting. (i) Tandem mass tagging (TMT)-based quantitative proteomic profiling of ML 1–50 in MDA-MB-231 cells. MDA-MB-231 cells were treated with DMSO vehicle or ML 1–50 (1 μM) for 24 h. Proteins that were lowered in levels by >2-fold with p < 0.001 are highlighted in red with BRD4 specifically labeled, alongside other JQ1 targets BRD2 and BRD3. Data are from n = 3 biologically independent replicates per group. Blots shown in (b, d, f, h) are representative of n = 3 biologically independent replicates per group. Bar graphs in (c, e, g) show average ± sem. Significance is expressed as *p < 0.05 compared to vehicle-treated controls and #p < 0.05 compared to ML 1–50 treatment alone.
Figure 3
Figure 3
Identifying the E3 ligase responsible for ML 1–50-mediated BRD4 degradation. (a) Structure of alkyne-functionalized probe of the vinylsulfonyl piperazine handle (highlighted in red). (b) ML 1–50-outcompeted targets enriched by ML 2–33. HEK293T cell lysate were pretreated with DMSO vehicle or ML 1–50 (200 μM) 1 h prior to treatment with the ML 2–33 probe (20 μM). Probe-modified proteins were subjected to copper-catalyzed azide alkyne cycloaddition (CuAAC) with an azide-functionalized biotin enrichment handle. Probe-modified proteins were avidin-enriched, tryptically digested, and analyzed by TMT-based proteomics. Among the significantly outcompeted targets, DCAF16 highlighted in red was the only Cullin E3 ligase substrate receptor identified. (c) Gel-based ABPP of ML 1–50 against pure DCAF16. Pure DCAF16 protein was preincubated with DMSO vehicle or ML 1–50 for 30 min prior to addition of a rhodamine-functionalized cysteine-reactive iodoacetamide probe (IA-rhodamine) (250 nM) for 1 h. Proteins were resolved by SDS/PAGE and assessed by in-gel fluorescence and protein loading was assessed by silver staining. (d) TMT-based quantitative proteomic analysis of DCAF16 wild-type (WT) versus knockout (KO) cells. Because there was no commercial DCAF16 antibody, proteomic methods were used to confirm DCAF16 knockout. DCAF16 is labeled in red. (e, f) BRD4 degradation in DCAF16 WT and KO HEK293 cells. DCAF16 WT and KO cells were treated with DMSO vehicle or ML 1–50 (1 μM) for 24 h and BRD4 and actin loading control levels were assessed by Western blotting and quantified in (f). (g) ML 1–50-mediated BRD4 degradation in DCAF16 KO HEK293 cells expressing WT, C58S, or C119S mutant FLAG-WT, C58S, or C119S DCAF16 was lentivirally and stably expressed in DCAF16 KO cells after which cells were treated with DMSO vehicle or ML 1–50 (1 μM) for 24 h and BRD4, FLAG-DCAF16, and loading control actin levels were assessed by Western blotting. (h, i) BRD4 and FLAG-DCAF16 levels from (g) were quantified. Proteomics experiments and blots in (b–i) are from n = 3 biologically independent replicates per group and blots are representative. Bar graphs in (f, h, i) show individual replicate values average ± sem. Significance is expressed as *p < 0.05 compared to vehicle-treated controls and #p < 0.05 compared to ML 1–50 treated DCAF16 WT cells in (f) and compared to ML 1–50 treated FLAG-DCAF16 WT-expressing cells in (h, i).
Figure 4
Figure 4
Testing the dependence of covalent monovalent BRD4 degraders on DCAF16 versus RNF126. (a) Structure of our previously published covalent monovalent BRD4 degrader JP-2–197 bearing the covalent “fumarate” handle shown in red. (b) BRD4 degradation in DCAF16 WT and KO HEK293 cells. DCAF16 WT and KO HEK293 cells were treated with DMSO vehicle or JP-2–197 for 24 h and BRD4 and actin loading control levels were assessed by Western blotting. (c, d) BRD4 degradation in RNF126 WT and KO cells. RNF126 WT and KO HEK293T cells were treated with JP-2–197 for 10 h and BRD4, RNF126, and GAPDH loading control levels were assessed by Western blotting and quantified in (d). (e, f) BRD4 degradation in RNF126 KO HEK293T cells. RNF126 WT and KO HEK293T cells were treated with ML 1–50 for 16 h and BRD4, RNF126, and actin loading control levels were assessed by Western blotting and quantified in (f). Blots in (b, c, e) are representative of n = 3 biologically independent replicates per group. Bar graph in (d, f) shows individual replicate values and average ± sem. Significance is expressed as *p < 0.05 compared to vehicle-treated controls and #p < 0.05 compared to JP-2–197 or ML 1–50 treated RNF126 WT cells.
Figure 5
Figure 5
Characterization of CDK4 monovalent degrader. (a) Structure of ML 1–71, a CDK4 inhibitor ribociclib bearing a vinylsulfonyl piperazine handle highlighted in red. (b, c) CDK4 degradation in C33A cervical cancer cells. C33A cells were treated with DMSO vehicle or ML 1–71 for 24 h and CDK4 and actin loading control levels were assessed by Western blotting and quantified in (c). (d, e) CDK4 degradation in DCAF16 WT and KO HEK293 cells. DCAF16 WT and KO HEK293 cells were treated with DMSO vehicle or ML 1–71 for 24 h and CDK4 and actin loading control levels were assessed by Western blotting and quantified in (e). (f) CDK4 levels in C33A cells. C33A cells were treated with DMSO vehicle, ML 1–71 (10 μM), or ML 2–33 for 24 h and CDK4 and loading control actin levels were assessed by Western blotting. (g) TMT-based quantitative proteomic profiling of ML 1–71 in C33A cells. C33A cells were treated with DMSO vehicle or ML 1–71 (10 μM) for 24 h. Proteins that were reduced in levels by >2-fold with p < 0.05 are designated in red with CDK4 labeled. Data are from n = 3 biologically independent replicates per group. Blots in (b, d, f) are representative of n = 3 biologically independent replicates per group. Bar graph in (e) shows individual replicate values and average ± sem. Significance is expressed as *p < 0.05 compared to vehicle-treated controls and #p < 0.05 compared to ML 1–71 treated DCAF16 WT cells.
Figure 6
Figure 6
Characterization of AR and BTK monovalent degraders. (a) Structure of AR monovalent degrader ML 2–9 with AR-targeting ligand derived from the ARV-110 PROTAC bearing the covalent vinylsulfonyl piperazine handle highlighted in red. (b, c) AR degradation in LNCaP prostate cancer cells. LNCaP cells were treated with DMSO vehicle or ML 2–9 for 24 h and AR and actin loading control levels were assessed by Western blotting and quantified in (c). (d) AR levels in LNCaP cells. LNCaP cells were treated with DMSO vehicle or ML 2–33 for 24 h and AR and loading control actin levels were assessed by Western blotting. (e) TMT-based quantitative proteomic profiling of ML 2–9 in LNCaP cells. LNCaP cells were treated with DMSO vehicle or ML 2–9 (1 μM) for 24 h. Proteins that were reduced in levels by >4-fold with p < 0.01 are designated in red with AR labeled. Data are from n = 3 biologically independent replicates per group. (f) Structure of BTK monovalent degrader TH 1–9 with BTK inhibitor derived from ibrutinib bearing the covalent vinylsulfonyl piperazine handle highlighted in red. (g, h) BTK degradation in MINO lymphoma cancer cells. MINO cells were treated with DMSO vehicle or TH 1–9 for 24 h and BTK and GAPDH loading control levels were assessed by Western blotting and quantified in (h). (i) BTK levels in MINO cells. MINO cells were treated with DMSO vehicle, TH1–9 (10 μM), or ML 2–33 for 24 h and BTK and loading control actin levels were assessed by Western blotting. (j) TMT-based quantitative proteomic profiling of TH 1–9 in MINO cells. MINO cells were treated with DMSO vehicle or TH 1–9 (5 μM) for 24 h. Proteins that were reduced in levels by >8-fold with p < 0.001 are designated in red with BTK labeled. Data are from n = 3 biologically independent replicates per group. Blots in (b, d, g, f) are representative of n = 3 biologically independent replicates per group. Bar graphs in (c, h) show individual replicate values and average ± sem. Significance is expressed as *p < 0.05 compared to vehicle-treated controls.

References

    1. Scholes N. S.; Mayor-Ruiz C.; Winter G. E. Identification and Selectivity Profiling of Small-Molecule Degraders via Multi-Omics Approaches. Cell Chem. Biol. 2021, 28 (7), 1048–1060. 10.1016/j.chembiol.2021.03.007. - DOI - PubMed
    1. Schreiber S. L. The Rise of Molecular Glues. Cell 2021, 184 (1), 3–9. 10.1016/j.cell.2020.12.020. - DOI - PubMed
    1. Krönke J.; Udeshi N. D.; Narla A.; Grauman P.; Hurst S. N.; McConkey M.; Svinkina T.; Heckl D.; Comer E.; Li X.; Ciarlo C.; Hartman E.; Munshi N.; Schenone M.; Schreiber S. L.; Carr S. A.; Ebert B. L. Lenalidomide Causes Selective Degradation of IKZF1 and IKZF3 in Multiple Myeloma Cells. Science 2014, 343 (6168), 301–305. 10.1126/science.1244851. - DOI - PMC - PubMed
    1. Mayor-Ruiz C.; Bauer S.; Brand M.; Kozicka Z.; Siklos M.; Imrichova H.; Kaltheuner I. H.; Hahn E.; Seiler K.; Koren A.; Petzold G.; Fellner M.; Bock C.; Müller A. C.; Zuber J.; Geyer M.; Thomä N. H.; Kubicek S.; Winter G. E. Rational Discovery of Molecular Glue Degraders via Scalable Chemical Profiling. Nat. Chem. Biol. 2020, 16 (11), 1199–1207. 10.1038/s41589-020-0594-x. - DOI - PMC - PubMed
    1. King E. A.; Cho Y.; Hsu N. S.; Dovala D.; McKenna J. M.; Tallarico J. A.; Schirle M.; Nomura D. K. Chemoproteomics-Enabled Discovery of a Covalent Molecular Glue Degrader Targeting NF-κB. Cell Chem. Biol. 2023, 30 (4), 394–402. 10.1016/j.chembiol.2023.02.008. - DOI - PMC - PubMed

LinkOut - more resources