. 2024 May 21;10(7):1332-1347.
doi: 10.1021/acscentsci.4c00312. eCollection 2024 Jul 24.

Rolosense: Mechanical Detection of SARS-CoV-2 Using a DNA-Based Motor

Affiliations

Rolosense: Mechanical Detection of SARS-CoV-2 Using a DNA-Based Motor

Selma Piranej et al. ACS Cent Sci. .

Abstract

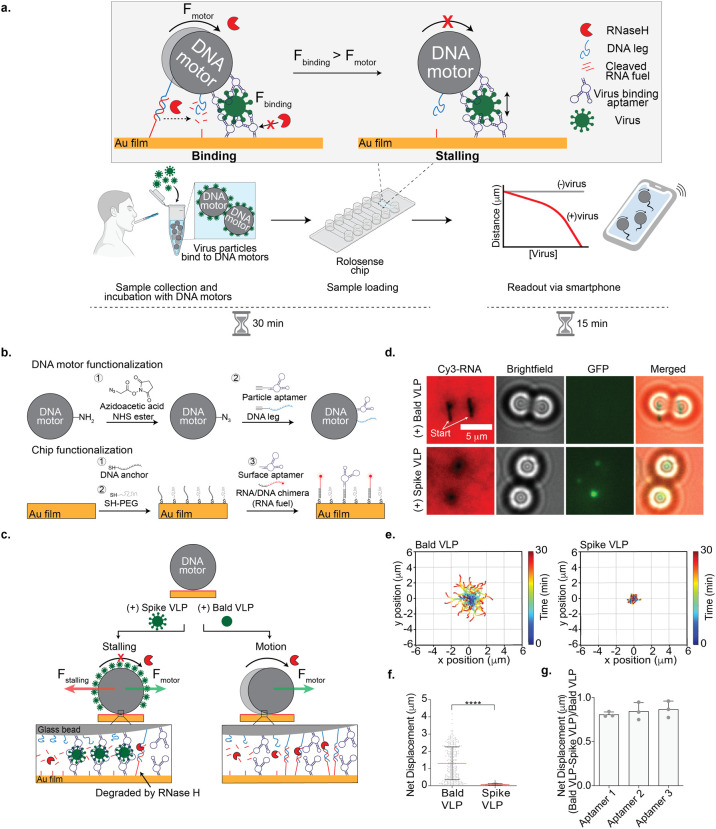
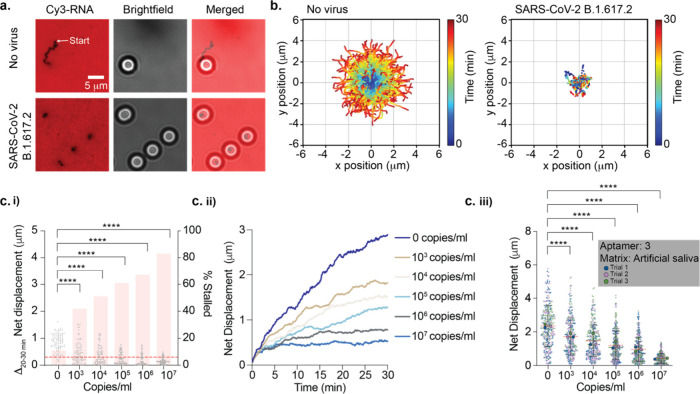
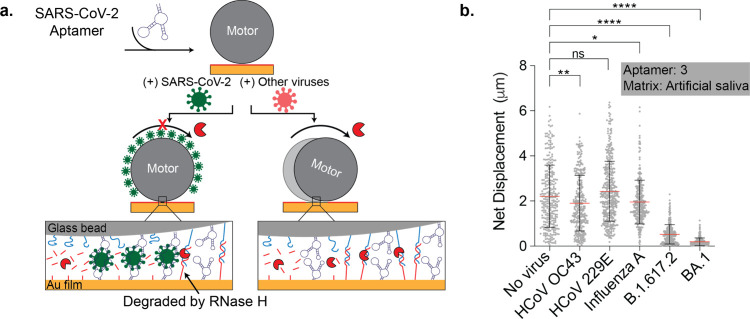
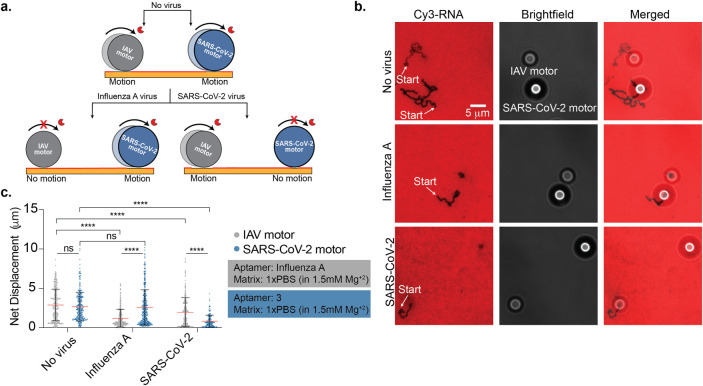
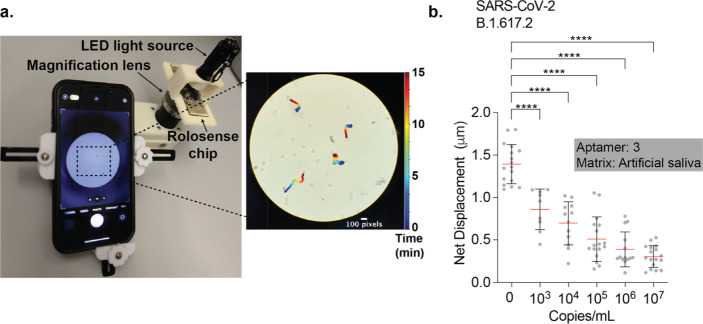
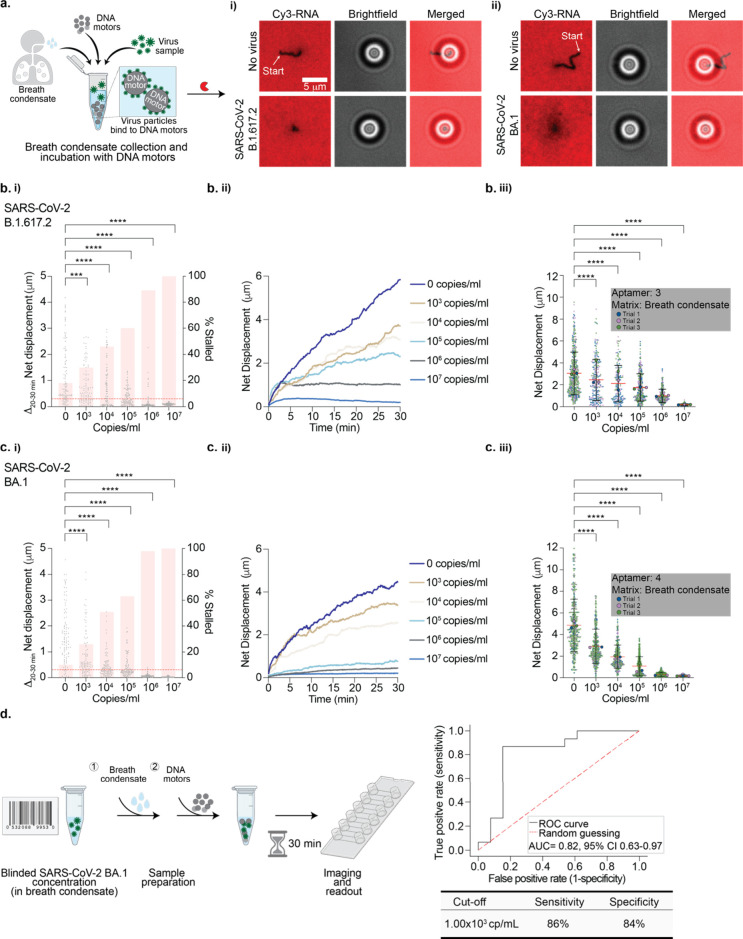
Assays that detect viral infections play a significant role in limiting the spread of diseases such as SARS-CoV-2. Here, we present Rolosense, a virus sensing platform that leverages the motion of 5 μm DNA-based motors on RNA fuel chips to transduce the presence of viruses. Motors and chips are modified with aptamers, which are designed for multivalent binding to viral targets and lead to stalling of motion. Therefore, the motors perform a "mechanical test" of the viral target and stall in the presence of whole virions, which represents a unique mechanism of transduction distinct from conventional assays. Rolosense can detect SARS-CoV-2 spiked in artificial saliva and exhaled breath condensate with a sensitivity of 103 copies/mL and discriminates among other respiratory viruses. The assay is modular and amenable to multiplexing, as demonstrated by our one-pot detection of influenza A and SARS-CoV-2. As a proof of concept, we show that readout can be achieved using a smartphone camera with a microscopic attachment in as little as 15 min without amplification reactions. Taken together, these results show that mechanical detection using Rolosense can be broadly applied to any viral target and has the potential to enable rapid, low-cost point-of-care screening of circulating viruses.


Conflict of interest statement

The authors declare no competing financial interest.

Figures

Figure 1
Figure 1
Optimizing Rolosense with GFP-labeled virus-like particles (VLPs). (a) Schematic workflow of the Rolosense assay. The motors multivalently bind to virus particles. The presence of virus particles leads to motor stalling, which reduces the net displacement or distance traveled by the motors. Readout can be performed using simple bright-field time-lapse imaging of the motors. In principle, readout can be performed in as little as 15 min using a smartphone camera. (b) Schematic of DNA motor and chip functionalization. The DNA motors were modified with a binary mixture of DNA leg and aptamers that have high affinity for the SARS-CoV-2 spike protein. The Rolosense chip is a gold film also composed of two nucleic acids: the RNA/DNA chimera, which is referred to as the RNA fuel, and the same aptamer as the motor. (c) Schematic of the detection of the SARS-CoV-2 virus. In the presence of VLPs expressed with spike protein (spike VLPs), the motors stall on the Rolosense chip following the addition of the RNaseH enzyme, as the stalling force (red arrow) is greater than the force generated by the motor (green arrow). When incubated with the bald VLPs or VLPs lacking the spike protein, the motors respond with motion and roll on the chip in the presence of RNaseH. (d) Bright-field and fluorescence imaging of DNA motors detecting GFP-labeled spike VLPs. The RNA fuel was tagged with Cy3, shown here in red. Motors were incubated with 25 pM GFP-labeled bald and spike VLPs diluted in 1× PBS. Samples with GFP-labeled spike VLPs show stalled motors and no Cy3 depletion tracks, in contrast to samples of GFP-labeled bald VLPs. Note that stalled motors often showed GFP signal colocalization. (e) Plots showing the trajectory of motors with bald and spike VLPs. All of the trajectories are aligned to 0,0 (center) of the plots for time = 0 min. Color indicates time (0 → 30 min). (f) Plot showing net displacement of over 100 motors incubated with 25 pM bald and spike VLPs. The error bars and the red lines represent the standard deviation and the mean of the distribution, respectively. **** indicates P < 0.0001. Experiments were performed in triplicate. (g) Plot showing the difference in net displacement between the bald and spike VLPs normalized by the bald VLP displacement in conditions using different aptamers. Each data point indicates the pooled average for an independent experiment. Error bars show the standard deviation.
Figure 2
Figure 2
Detecting SARS-CoV-2 virus in artificial saliva. (a) Fluorescence and bright-field imaging of DNA motors detecting the presence of 107 copies/mL UV-inactivated SARS-CoV-2 B.1.617.2 spiked in artificial saliva. DNA motors were incubated for 30 min with the virus samples. Samples with SARS-CoV-2 show stalled motors and no depletion tracks, in contrast to samples lacking the virus. (b) Plots showing the trajectories of motors with no virus and 107 copies/mL UV-inactivated SARS-CoV-2 B.1.617.2 strain spiked in artificial saliva. All the trajectories are aligned to 0,0 (center) of the plots for time = 0 min. Color indicates time (0 → 30 min). (c) (i) Plots of the Δnet displacement as well as the percentage of motors stalled in the final 10 min of the 30 min time-lapse (t = 20–30 min) for 100 motors incubated with various concentrations of SARS-CoV-2 B.1.617.2. To calculate a percentage of stalled motors, a 0.300 μm threshold was used (red dashed line). (ii) Plots of the net displacement over the 30 min time-lapse for 30 motors incubated with different concentrations of SARS-CoV-2 B.1.617.2. (iii) Superplots of net displacement of over 300 motors for three independent replicates. Each motor is color-coded based on the triplicate data: blue for trial 1, pink for trial 2, and green for trial 3. The mean for each trial is superimposed on top of the plots. The error bars and the red lines represent the standard deviation and the mean of the distribution, respectively. UV-inactivated SARS-CoV-2 B.1.617.2 samples were spiked in artificial saliva and incubated with motors functionalized with aptamer 3 at room temperature for 30 min. **** indicates P < 0.0001.
Figure 3
Figure 3
Motors demonstrate a specific response to SARS-CoV-2 viruses. (a) Schematic of motors modified with SARS-CoV-2 aptamer stalling when incubated with SARS-CoV-2 virus particles, which is in contrast to motors incubated with other viruses. (b) Plot showing the net displacement for over 100 motors incubated with 107 copies/mL UV-inactivated HCoV OC43, HCoV 229E, influenza A, SARS-CoV-2 B.1.617.2, and SARS-CoV-2 BA.1 spiked in artificial saliva. The motors were functionalized with aptamer 3 and incubated for 30 min with each sample. All measurements were performed in triplicate. The error bars and the red lines represent the standard deviation and the mean of the distribution, respectively. ns, *, **, and **** indicate not statistically significant, P < 0.05, P < 0.01, and P < 0.0001, respectively.
Figure 4
Figure 4
Multiplexed detection of SARS-CoV-2 and influenza A viruses. (a) Schematic showing multiplexed detection of influenza A virus (IAV) and SARS-CoV-2. Two types of motors specific to SARS-CoV-2 (blue, 6 μm polystyrene) and IAV (gray, 5 μm silica) were encoded based on the size and composition of the microparticles and used to simultaneously detect these two respiratory viruses. The two types of motors were mixed together and incubated for 30 min with the virus sample. (b) Fluorescence and bright-field imaging of DNA motors with no virus, 107 copies/mL UV-inactivated SARS-CoV-2 WA-1, and 1010 copies/mL IAV. Representative images showing the two different DNA motors are shown, and each type of motor can be identified based on the bright-field particle size and contrast. Samples with SARS-CoV-2 show stalled 6 μm motors, while the IAV samples showed only stalled 5 μm particles. Samples lacking any virus showed motion of both types of motors. (c) Plots showing the net displacement for over 300 motors incubated with 107 copies/mL UV-inactivated SARS-CoV-2 WA-1 and 1010 copies/mL IAV spiked in 1× PBS supplemented with 1.5 mM Mg2+. Experiments were performed in triplicate. The error bars and the red lines represent the standard deviation and the mean of the distribution, respectively. ns and **** indicate not statistically significant and P < 0.0001, respectively.
Figure 5
Figure 5
Detecting SARS-CoV-2 B.1.617.2 using smartphone-based readout. (a) Setup of cellphone microscope (Cellscope) which is 3D-printed and includes an LED flashlight along with a smartphone holder and simple optics. The representative microscopy image shows an image of DNA motors that were analyzed by using our custom particle tracking analysis software. Moving particles show a color trail that indicates position–time (0 → 15 min). The scale bar is 100 pixels (or 30 μm), and the diameter of the motors is 5 μm. (b) Plots showing net displacement for over 10 motors incubated with different concentrations of UV-inactivated SARS-CoV-2 B.1.617.2 samples spiked in artificial saliva. The net displacement of the motors was calculated from 15 min videos acquired using a cellphone camera. The error bars and the red lines represent the standard deviation and the mean of the distribution, respectively. The motors were functionalized with aptamer 3, and experiments were run in triplicate. **** indicates P < 0.0001.
Figure 6
Figure 6
Detecting SARS-CoV-2 virus in breath condensate. (a) (left) Schematic of breath condensate sample collection and incubation of DNA-based motors with spiked-in virus particles. (i) Fluorescence and bright-field imaging of aptamer-3-modified DNA-based motors without virus and with 107 copies/mL SARS-CoV-2 B.1.617.2. (ii) Fluorescence and bright-field imaging of aptamer-4-modified DNA motors without virus and with 107 copies/mL SARS-CoV-2 BA.1. Samples without virus show long depletion tracks in the Cy3-RNA channel, but no tracks are observed following sample incubation with 107 copies/mL SARS-CoV-2 B.1.617.2 and BA.1. (b) (i) Plots of the Δnet displacement as well as the percentage of motors stalled in the last 10 min of the 30 min time-lapse for 100 motors incubated with different concentrations of SARS-CoV-2 B.1.617.2. A threshold of 0.300 μm (red dotted line) was used for the percentage of stalled motors. (ii) Plots of the net displacement over the 30 min time-lapse for 30 motors incubated with different concentrations of SARS-CoV-2 B.1.617.2. (iii) Superplots of net displacement of over 300 motors for three independent replicates. Each motor is color-coded based on the triplicate data: blue for trial 1, pink for trial 2, and green for trial 3. The mean for each trial is superimposed on top of the plots. The error bars and the red lines represent the standard deviation and the mean of the distribution, respectively. (c) (i) Plots of the Δnet displacement as well as the percentage of motors stalled in the last 10 min of the 30 min time-lapse for 100 motors incubated with different concentrations of SARS-CoV-2 BA.1. To calculate a percentage of stalled motors, a 0.300 μm threshold was used (red dotted line). (ii) Plots of the net displacement over the 30 min time-lapse for 30 motors incubated with different concentrations of SARS-CoV-2 BA.1. (iii) Superplots of net displacement of over 300 motors for three independent replicates. Each motor is color-coded based on the triplicate data: blue for trial 1, pink for trial 2, and green for trial 3. The mean for each trial is superimposed on top of the plots. The error bars and the red lines represent the standard deviation and the mean of the distribution, respectively. Both SARS-CoV-2 B.1.617.2 and BA.1 were UV-inactivated. **** indicates P < 0.0001. (d) (left) Schematic of the blinded LoD challenge panel in which blinded SARS-CoV-2 BA.1 samples were diluted in breath condensate and incubated with aptamer-4-modified DNA-based motors. After 30 min, the motors were added to the Rolosense chip modified with aptamer 4 and imaged. (right) Receiver operating characteristic (ROC) curve evaluating the discrimination between SARS-CoV-2 BA.1-positive and -negative samples. The area under the curve is 0.82, and the 95% confidence interval (CI) is 0.63–0.97. The sensitivity and specificity values are 86% and 84%, respectively, with the best cutoff value at 1.00 × 10³ copies/mL.

Update of

Similar articles

Cited by

References

    1. Vogels C. B. F.; et al. Analytical sensitivity and efficiency comparisons of SARS-CoV-2 RT-qPCR primer–probe sets. Nat. Microbiol. 2020, 5, 1299–1305. 10.1038/s41564-020-0761-6. - DOI - PMC - PubMed
    1. Larremore D. B.; et al. Test sensitivity is secondary to frequency and turnaround time for COVID-19 screening. Sci. Adv. 2021, 7, eabd5393.10.1126/sciadv.abd5393. - DOI - PMC - PubMed
    1. Nawattanapaiboon K.; et al. Colorimetric reverse transcription loop-mediated isothermal amplification (RT-LAMP) as a visual diagnostic platform for the detection of the emerging coronavirus SARS-CoV-2. Analyst 2021, 146, 471–477. 10.1039/D0AN01775B. - DOI - PubMed
    1. Rabe B. A.; Cepko C. SARS-CoV-2 detection using isothermal amplification and a rapid, inexpensive protocol for sample inactivation and purification. Proc. Natl. Acad. Sci. U. S. A. 2020, 117, 24450–24458. 10.1073/pnas.2011221117. - DOI - PMC - PubMed
    1. Lu R.; et al. Development of a Novel Reverse Transcription Loop-Mediated Isothermal Amplification Method for Rapid Detection of SARS-CoV-2. Virol. Sin. 2020, 35, 344–347. 10.1007/s12250-020-00218-1. - DOI - PMC - PubMed

LinkOut - more resources