. 2024 Jun 14;11(7):nwae206.
doi: 10.1093/nsr/nwae206. eCollection 2024 Jul.

Spike N354 glycosylation augments SARS-CoV-2 fitness for human adaptation through structural plasticity

Affiliations

Spike N354 glycosylation augments SARS-CoV-2 fitness for human adaptation through structural plasticity

Pan Liu et al. Natl Sci Rev. .

Abstract

Selective pressures have given rise to a number of SARS-CoV-2 variants during the prolonged course of the COVID-19 pandemic. Recently evolved variants differ from ancestors in additional glycosylation within the spike protein receptor-binding domain (RBD). Details of how the acquisition of glycosylation impacts viral fitness and human adaptation are not clearly understood. Here, we dissected the role of N354-linked glycosylation, acquired by BA.2.86 sub-lineages, as a RBD conformational control element in attenuating viral infectivity. The reduced infectivity is recovered in the presence of heparin sulfate, which targets the 'N354 pocket' to ease restrictions of conformational transition resulting in a 'RBD-up' state, thereby conferring an adjustable infectivity. Furthermore, N354 glycosylation improved spike cleavage and cell-cell fusion, and in particular escaped one subset of ADCC antibodies. Together with reduced immunogenicity in hybrid immunity background, these indicate a single spike amino acid glycosylation event provides selective advantage in humans through multiple mechanisms.

Keywords: adjustable infectivity; co-factor usage; conformational modulator; coronavirus glycosylation; viral evolution; viral fitness.


Figures

Figure 1.
Figure 1.
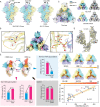
N354 glycosylation modulates RBD conformation. (A) Surface characterization of S-trimer of BA.2.86 and JN.1 in ‘up’ and ‘closed’ conformational states. The three subunits of S protein are colored in yellow, light blue, and purple, respectively, and the N-glycans are highlighted with sticks. (B) The glycosylation modifications at N245 and N354 in BA.2.86 sublineages are shown in detail. (C) RBD of the ‘closed’ conformation of BA.2.86 S-trimer superimposed with the XBB.1.5 S-trimer. Top view (top right) and center section (bottom right) show intersubunit contacts of BA.2.86 and XBB.1.5 S-trimers. (D) The conformational change details between BA.2.86 (yellow) and XBB.1.5 (gray) in S1 subunit. The shift distances and directions of NTD, RBD, and SD2 towards the 3-fold axis are labeled. (E) The role of N354 glycosylation in regulating changes in the ‘up’ and ‘down’ conformational ratio of the RBD in ‘Remove N354 glycosylation’, ‘Gain N354 glycosylation’ and ‘Control’ groups. In each group, the proportion of ‘RBD-down’ conformation are displayed with a bar chart. Blue and pink bars represent variants without and with N354 glycosylation. (F) The buried surface areas (BSA) between RBDs of D614G, XBB.1.5, WT, BA.2.86, RaTG13, and S52 are compared. (G) A correlation plot created between the contact area between RBD subunits and the ‘RBD-down’ rate.
Figure 2.
Figure 2.
N354 glycosylation decreases infectivity, but not via compromising binding to hACE2. (A) Relative infectivity of XBB.1.5, D614G, Delta BA.1, BA.2, EG.5.1, BA.2.86, and JN.1. Vesicular stomatitis virus-based pseudoviruses were used to test the efficiency of infecting 293T-ACE2, Vero, and Huh-7 cells. Error bars represent the mean ± SD of three replicates. All raw data of infectivity are normalized by XBB.1.5. (B) Relative infectivity of BA.2, XBB.1.5, and BA.2.86 variants with mutations at positions 356 and 621, compared to their respective wild types, evaluated in 293T-ACE2, Vero, and Huh-7 cells. Error bars represent the mean ± SD of three replicates. (C) The impact of glycosylation at position 354 of BA.2.86, BA.2.75, and XBB.1.5 RBDs on the binding affinity to hACE2 assessed by SPR. (D) Surface characterization of two ‘up’ RBD conformations of BA.2.86 S-trimer binding to hACE2 determined by cryo-EM. The color scheme for three subunits of S are consistent with Fig. 1A and hACE2 is colored in pink. (E) Changes in affinity of binding hACE2 from early SARS-CoV-2 variants of concern (VOCs) and Omicron variants to late Omicron variants. (F) The effect of a single substitution on the binding affinity to hACE2 was assessed using SPR. Mutations that greatly enhance, moderately enhance, and decrease the affinity to hACE2 are indicated in red, light purple, and yellow, respectively. The cutoff value of greatly increasing affinity is set as a 3-fold change in KD value relative to BA.2.86. (G) Evaluation of binding affinity to hACE2 of the variants with 1–2 mutations on the RBM of BA.2.86 by SPR. These variants are based on predictions of increased binding affinity to hACE2.
Figure 3.
Figure 3.
Mechanism of the ability of heparan sulfate recovering decreased infectivity by N354 glycosylation. (A) The infectivity of BA.5, BA.2.75, XBB.1.5, BA.2.86-T356K (blue) and their corresponding K356T (pink) mutant virus-like particles (SC2-VLPs) in 293T-ACE2/Furin cells with or without preincuation with increasing concentraion of HS. (B) Binding affinity of RBDs of BA.5, BA.2.75, XBB.1.5, BA.2.86-T356K and their corresponding K356T mutant to HS tested by SPR. (C) The cryo-EM structures of BA.2.86 and BA.2.86-T356K S-trimer bound to HS are shown in the upper and lower panels, respectively. In each panel's left corner, HS was docked to S-trimer by MOE. The binding grooves of HS are indicated by ‘dotted zones’ on the electrostatic surface of S-trimer. Pink surface of N354 glycosylation on BA.2.86 is highlighted by yellow stars. In the upper right corner, the explicit binding location of HS ‘N354 pocket’ in groove has been zoomed in and indicated by a light-yellow shadow. HS determined by cryo-EM and docked by MOE are colored in green and white, respectively. In the lower right corner, interface details of HS determined by cryo-EM with S-trimer are shown. Hydrogen bonds are displayed by yellow dashed lines. The unit of value for the color bar is kcal/(mol·e) at 298 K. (D) Influence of HS on the ‘RBD-up’ conformational proportion within the S-trimer of BA.2.86, JN.1, BA.2.86-T356K, and XBB.1.5. Both BA.2.86 and JN.1 are glycosylated at position N354, shown in red bars. BA.2.86-T356K and XBB.1.5, which lack glycosylation at position N354, are shown in blue bars. (E) Surface and cartoon representation of HS binding grooves consisting of a pair of spatially adjacent RBD (purple) and NTD (cyan) from different subunits of BA.2.86 (upper panel) and BA.2.86-T356K (lower panel). In each panel, apo state and HS-bound state are shown. Distance of HS binding grooves is indicated by orange dashed curves.
Figure 4.
Figure 4.
S cleavage and fusogenicity of BA.2.86. (A) Sequence alignment and modeled charge surface representation of PBCS consisting of P681, H681, and R681. S cleavage efficiency evaluated by Western blotting (B) and image grayscale analysis (C) for WT, Delta, BA.2, BA.2.86, BA.2.86-T356K, and BA.2.86-S621P. (D) Fusogenicity among WT, Delta, BA.1, BA.2, XBB.1.16, and BA.2.86 by using a split GFP system. (E) Fusogenicity of spikes bearing K356T, P621S, and H681R mutation on XBB.1.5 relative to XBB.1.5 (left) and spikes bearing T356K, S621P, and R681H mutation on BA.2.86 relative to BA.2.86 (right). (F) The location of N354 glycan (red), 630 loop (pink), and PBCS (blue) on S-trimer is shown on the left. T356, G614, S621, and R681 are displayed as orange spheres. Pattern diagram of K356T increasing S1 shedding by allosteric effect is shown in the middle. Cartoon representations of 630 loop of BA.2.86-S621P and BA.2.86 are zoomed in on the right.
Figure 5.
Figure 5.
K356T coupled N354 glycosylation specially escapes a subset of ADCC antibodies. (A) t-SNE and unsupervised clustering of antibodies that bind SARS-CoV-2 RBD. Twelve epitope groups were identified from the DMS dataset (3051 antibodies). (B) Heatmap of neutralizing activity against XBB.1.5, XBB.1.5-K356T, BA.2.86, BA.2.86-T356K, and JN.1 of representative antibodies from 10 epitope groups, relative to BA.5. (C) Mapping of escape scores for antibodies from epitope group E1 (‘left flank’), E2.1 (‘chest’), E2.2 (‘chest’), and E3 (‘right flank’) on SARS-CoV-2 RBD (PDB: 6M0J). (D) Heatmap of ADCC effect of RBD antibodies. Four types of color bars represent the base 10 logarithm of the maximum of experiment curve, the base 10 logarithm of the maximum of the fitting curve by four parameters fitting, the base 10 logarithm of EC50 and area under curve from Fig. S7. The antibodies with ‘grey bar’ representations were not selected to perform ADCC assays. These antibodies cannot bind to the WT RBD, but the surface antigens of the target cell for ADCC assays are from SARS-CoV-2 WT variant.
Figure 6.
Figure 6.
N354 glycosylation reduces immunogenicity in a hybrid immunity background. (A) Two cohorts of mice evaluating the immunogenicity of various SARS-CoV-2 variants. One cohort consisted of non-immunized BALB/c mice that received two doses of spike proteins (BA.5, XBB.1.5, EG.5.1, BA.2.86, BA.2.86-T356K), with a 14-day interval between each dose. The other cohort mimicked a real-world immunity background, where BALB/c mice were immunized with an inactivated vaccine (two doses of WT + one dose of BA.5) in addition to a single dose of spike protein (BA.5, XBB.1.5, EG.5.1, BA.2.86, BA.2.86-T356K). Blood samples were collected 14 days after immunization. The 50% neutralizing titer (NT50s) against Omicron variants (BA.5, XBB.1.5, EG.5.1, BA.2.86, BA.2.86-T356K) in plasma from a non-immunized BALB/c mice background (B) and from BALB/c mice simulating a real-world immune background (D). The p-values were calculated via a two-tailed Wilcoxon signed-rank test for paired samples. Radar plots of the spectrum of neutralization and bar charts of the immunogenicity of the five types of immunogens from a single immunity background (C) and a real-world mimicry immunity background (E).

References

    1. Zhang J, Cai Y, Xiao T et al. Structural impact on SARS-CoV-2 spike protein by D614G substitution. Cell Rep 2021; 372: 893–908.e7.10.1126/science.abf2303 - DOI - PMC - PubMed
    1. Cao Y, Jian F, Wang J et al. Imprinted SARS-CoV-2 humoral immunity induces convergent Omicron RBD evolution. Nature 2023; 614: 521–9. - PMC - PubMed
    1. Yisimayi A, Song W, Wang J et al. Repeated Omicron exposures override ancestral SARS-CoV-2 immune imprinting. Nature 2024; 625: 148–56.10.1038/s41586-023-06753-7 - DOI - PMC - PubMed
    1. Liu Y. Attenuation and degeneration of SARS-CoV-2 despite adaptive evolution. Cureus 2023; 15: e33316. - PMC - PubMed
    1. Harbison AM, Fogarty CA, Phung TK et al. Fine-tuning the spike: role of the nature and topology of the glycan shield in the structure and dynamics of the SARS-CoV-2 S. Chem Sci 2022; 13: 386–95.10.1039/D1SC04832E - DOI - PMC - PubMed

LinkOut - more resources