[Preprint]. 2024 Oct 1:2024.07.13.603366.
doi: 10.1101/2024.07.13.603366.

Massive experimental quantification of amyloid nucleation allows interpretable deep learning of protein aggregation

Affiliations

Massive experimental quantification of amyloid nucleation allows interpretable deep learning of protein aggregation

Mike Thompson et al. bioRxiv. .

Update in

Abstract

Protein aggregation is a pathological hallmark of more than fifty human diseases and a major problem for biotechnology. Methods have been proposed to predict aggregation from sequence, but these have been trained and evaluated on small and biased experimental datasets. Here we directly address this data shortage by experimentally quantifying the amyloid nucleation of >100,000 protein sequences. This unprecedented dataset reveals the limited performance of existing computational methods and allows us to train CANYA, a convolution-attention hybrid neural network that accurately predicts amyloid nucleation from sequence. We adapt genomic neural network interpretability analyses to reveal CANYA's decision-making process and learned grammar. Our results illustrate the power of massive experimental analysis of random sequence-spaces and provide an interpretable and robust neural network model to predict amyloid nucleation.


Conflict of interest statement

Competing interests The authors have declared no competing interests.

Figures

Figure 1.
Figure 1.. Quantifying the nucleation of >100,000 random peptides.
(A) Examples of amyloids in human diseases. (B) The amyloid state is thermodynamically favorable, but requires overcoming a kinetic barrier. (C) Experimental design. (D) While we explore over 110,000 sequences, our dataset is a tiny sample of the possible sequence space. (E) The assayed nucleation scores of sequences labeled “Nucleators” and “Non-nucleators” in our experiment. (F) An example of a follow-up replication experiment using a synthesized library (NNK3; see Supplementary Fig. 1 for others; Supplementary Data File 3).
Figure 2.
Figure 2.. Nucleation is poorly predicted by existing models and subtly related to amino acid composition
(A) The percent composition of residues grouped by their physicochemical properties in nucleators and non-nucleators. (B) The hydrophobicity and beta-sheet propensity of assayed sequences relative to known human amyloids (Supplementary Table 2) and the human proteome. (C) The predictive power (AUC ± 95% CI) of previous amyloid predictors on the random sequences. (D, E) The position-specific differences in amino acid frequencies across nucleating and non-nucleating sequences. Asterisks indicate marginal p-value (chi-square test) lower than 0.05 “*”; lower than 0.01 “**”; lower than 0.001 “***”.
Figure 3.
Figure 3.. Convolution-Attention Network of amYloid Aggregation (CANYA).
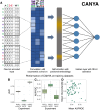
(A) CANYA is a 3-layer neural network with 65,491 parameters. The model contains 100 filters, a single attention head with key-length 6, a dense layer with 64 nodes, and finally a sigmoid output layer. (B-D) Evaluation metrics across the top 50 performing (of 100) model fits of CANYA. (B) The area under receiver operating characteristic curve (AUC) for held-out testing sequences. (C) The area under precision recall curve (AUPROC) for held-out testing sequences. (D) The interpretability score (KL divergence; Methods) calculated on all held-out test sequences plotted against the mean AUPROC across experiments. See Supplementary Fig. 3 for results on all 100 model fits.
Figure 4
Figure 4. An additional experiment of >7,000 random sequences.
(A) The nucleation rates over an additional validation set of 7,040 random sequences. (B) The predictive performance (AUC ± 95% CI) of CANYA and previous methods on the additional dataset.
Figure 5
Figure 5. Stable performance of CANYA across diverse prediction tasks.
The AUC of CANYA and previous methods across several external datasets. Low-opacity bars represent cases in which the method used data from the testing dataset for training and thus are not valid out-of-sample evaluations. See text for additional descriptions of datasets (Methods, Supplementary Table 5) as well as performance reported as area-under precision-recall curve (AUPROC; Supplementary Fig. 6).
Figure 6
Figure 6. CANYA discovers physicochemical nucleation motifs.
The motifs discovered by CANYA, clustered by their physicochemical properties and GIA effect sizes, then sorted based on their effect size magnitude. Translucency represents the ratio of cluster effect size compared to the strongest cluster (Methods). The enrichment (in AUC) of motif-cluster presence in secondary structures of resolved amyloids in Uniprot (Methods; Supplementary Fig. 7). The dashed lines represent an AUC of 0.50 and asterisks represent structures for which the enrichment was significantly higher than both 0.50 and the second most-enriched structure.
Figure 7.
Figure 7.. in-silico experiments reveal CANYA’s learned nucleation grammar.
(A) An example of an experiment using GIA, an explainability tool to extract importance (effect sizes) of features in a model. Briefly, model predictions for a background set of sequences are compared to predictions on the same set of sequences with a feature (motif) embedded in them. (B) The distribution of effects from adding 1–4 copies of a cluster-motif to sequences. Points represent importance. (C) Interaction importance from adding motifs from two clusters to sequences. Warmer colors indicate higher CANYA score than from marginally adding the motifs (and their effects) separately to sequences, whereas cooler colors represent a CANYA score lower than expected from adding marginal motif effects. “X” indicates effects that were not significantly different from 0. (D) The position-dependence of motif effects. Plotted is the percent change of a position-specific effect relative to the motif’s global, position-averaged effect. Stars represent a significantly non-zero percent change in effect.

References

    1. Chiti F. & Dobson C. M. Protein Misfolding, Amyloid Formation, and Human Disease: A Summary of Progress Over the Last Decade. Annu. Rev. Biochem. 86, 27–68 (2017). - PubMed
    1. Fowler D. M., Koulov A. V., Balch W. E. & Kelly J. W. Functional amyloid--from bacteria to humans. Trends Biochem. Sci. 32, 217–224 (2007). - PubMed
    1. Shire S. J. Formulation and manufacturability of biologics. Curr. Opin. Biotechnol. 20, 708–714 (2009). - PubMed
    1. Ke P. C. et al. Half a century of amyloids: past, present and future. Chem. Soc. Rev. 49, 5473–5509 (2020). - PMC - PubMed
    1. Dobson C. M., Knowles T. P. J. & Vendruscolo M. The Amyloid Phenomenon and Its Significance in Biology and Medicine. Cold Spring Harb. Perspect. Biol. 12, (2020). - PMC - PubMed

Publication types