[Preprint]. 2024 Jul 19:2024.07.17.604013.
doi: 10.1101/2024.07.17.604013.

Cytoplasmic ribosomes on mitochondria alter the local membrane environment for protein import

Affiliations

Cytoplasmic ribosomes on mitochondria alter the local membrane environment for protein import

Ya-Ting Chang et al. bioRxiv. .

Update in

Abstract

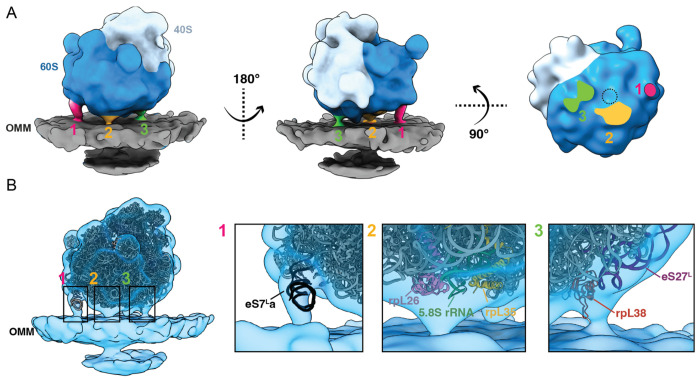
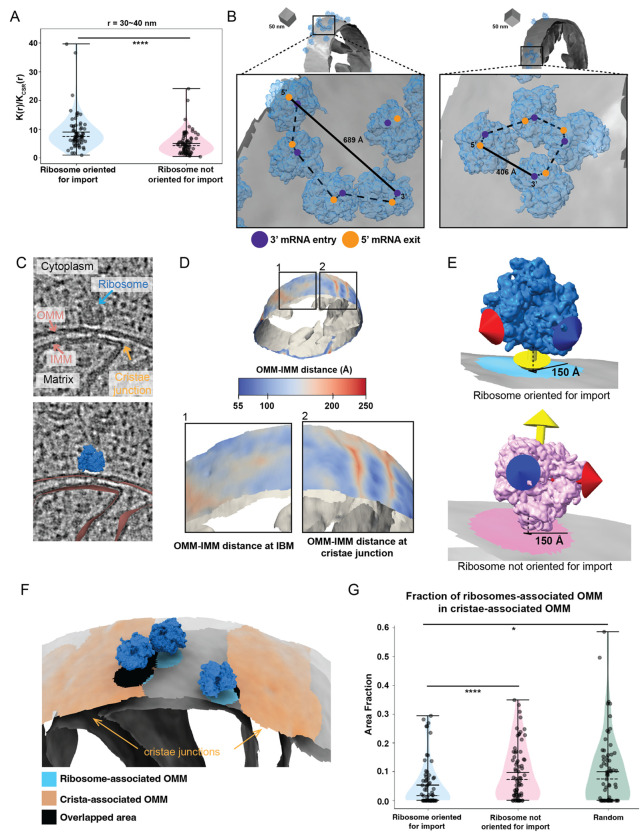
Most of the mitochondria proteome is nuclear-encoded, synthesized by cytoplasmic ribosomes, and targeted to mitochondria post-translationally. However, a subset of mitochondrial-targeted proteins is imported co-translationally, although the molecular mechanisms governing this process remain unclear. We employ cellular cryo-electron tomography to visualize interactions between cytoplasmic ribosomes and mitochondria in Saccharomyces cerevisiae. We use surface morphometrics tools to identify a subset of ribosomes optimally oriented on mitochondrial membranes for protein import. This allows us to establish the first subtomogram average structure of a cytoplasmic ribosome on the surface of the mitochondria in the native cellular context, which showed three distinct connections with the outer mitochondrial membrane surrounding the peptide exit tunnel. Further, this analysis demonstrated that cytoplasmic ribosomes primed for mitochondrial protein import cluster on the outer mitochondrial membrane at sites of local constrictions of the outer and inner mitochondrial membrane. Overall, our study reveals the architecture and the spatial organization of cytoplasmic ribosomes at the mitochondrial surface, providing a native cellular context to define the mechanisms that mediate efficient mitochondrial co-translational protein import.


Figures

Figure 1.
Figure 1.. Cellular cryo-electron tomography imaging and processing workflow captures cytoplasmic ribosomes positioned for protein import on mitochondrial membranes.
A. Saccharomyces cerevisiae (S. cerevisiae) yeast expressing TIM50-GFP are grown in respiratory or fermentative conditions and treated with vehicle or cycloheximide (CHX, 100 μg/mL) prior to deposition on electron microscopy grids (black mesh circle) and vitrification via plunge freezing. B. Vitrified yeast were imaged by cryo-fluorescence microscopy (cryo-FM) to assess sample quality, cell density, and ice thickness. C. Clumps of yeast were targeted for cryo-focused ion beam (cryo-FIB) milling to generate thin cellular sections (i.e., lamellae). D. Cellular lamella were imaged by standard cryo-electron tomography acquisition procedures to generate tilt series that were further processed to generate three-dimensional reconstructions (i.e., tomograms). Subcellular components such as mitochondria, the endoplasmic reticulum, the plasma membrane, and ribosomes are visible within the resulting tomograms. Scale bars = 250 nm E. Reconstructed tomograms were processed through ‘particle picking’ software, which identified the initial positions and orientations of all visible cellular ribosomes. The positions and orientations were refined using subtomogram averaging to produce a consensus 8 Å 80S ribosome structure. F. Mitochondrial membranes were traced, and separate three-dimensional voxel segmentations were generated for the outer and inner mitochondrial membranes (OMM and IMM, respectively). These voxel segmentations were converted to surface mesh reconstructions using the Surface Morphometrics (Barad, Medina et al. 2023) pipeline such that the location of the membrane is represented by the coordinate of each triangle within the mesh. G. The position and orientation of each ribosome relative to the OMM surface mesh reconstruction was calculated and rendered in the ArtiaX module of ChimeraX. The three-color arrows on ribosomes represent the Euler angle, with the yellow arrow representing the orientation of the ribosome peptide exit tunnel. H. The cutoff for identifying cytoplasmic ribosomes engaged in protein import on OMM was established by referring the distance between the peptide exit tunnel of ER-translocon ribosome and ER membrane. The optimal cutoff of the distance between exit tunnel and OMM was identified as 0-95 Å in ArtiaX as we started to observe the exit tunnel pointed away from OMM in the expanded cutoff, either 0-110 Å or 0-120 Å. I. Cytoplasmic ribosomes optimally positioned for protein import were identified as those with their exit tunnel closer than 95 Å from the OMM.
Figure 2.
Figure 2.. Three-dimensional subtomogram average of a cytoplasmic ribosome optimally positioned for protein import on the outer mitochondrial membrane (OMM).
A. Three views of the subtomogram average of a cytoplasmic ribosome positioned with the exit tunnel on the 60S subunit (dark blue) facing the OMM (gray). Three connecting densities (labeled 1, 2, 3 in pink, orange, and green, respectively) are visible between the 60S and the OMM surrounding the peptide exit tunnel (dashed circle). B. The subtomogram average of the mitochondria-associated ribosome (blue transparent density) with a fitted atomic model of the S. cerevisiae 80S ribosome (PDB 4V6I). Boxed regions focus on the cryo-EM density of each of the three connections observed between the cytoplasmic ribosome and the OMM.
Figure 3.
Figure 3.. Cytoplasmic ribosomes primed for protein import cluster on the mitochondrial membrane.
A. Quantification of the maximum value of K(r)/KCSR(r) for a 30-40 nm radius for each tomogram within the indicated ribosome class. P values from Mann-Whitney U test are indicated. *P < 0.05; **P < 0.01; ***P < 0.005; ****P < 0.001. B. Representative membrane surface reconstructions of mitochondria (gray) with ribosomes oriented for import relative to the OMM (blue). Insets show zoomed-in boxed regions of the ribosome models with circle overlays demarking the location of the 3’ mRNA entry (blue), the 5’ mRNA exit sites (orange), the possible pathways of interconnecting mRNA (dashed black line), and the calculated end-to-end distance from 5’ to 3’ of each interconnected mRNA (solid black line). C. Representative tomogram slices showing labeled cytoplasm, ribosome, mitochondrial matrix, IMM, OMM, and cristae junctions (upper panel) with an overlay of surface mesh reconstructions of IMM and OMM (red) and ribosome (blue) (lower panel). D. Representative membrane surface reconstruction of mitochondria with the OMM surface colored by outer-to-inner (OMM-IMM) membrane distance and the IMM surface shown in gray. The bottom inset labeled “1” shows inner membrane boundary (IBM) regions on OMM with more subtle OMM-IMM distance variations. In contrast, the bottom inset labeled “2” shows regions on OMM with large OMM-IMM distances corresponding to cristae junctions. E. Ribosome and membrane models defining the patches on the membrane surface mesh reconstruction that correspond to ribosomes oriented for import (blue, top) and ribosomes near but not oriented for import (pink, bottom). The ribosomes oriented for import are defined as those with the peptide exit tunnel (yellow arrow) pointed toward the membrane. In contrast, those not oriented for import have peptide exit tunnels facing away from the membrane. F. Representative ribosome and membrane model with the OMM surface colored by the ribosome-associated (blue) and crista-associated OMM (orange), with areas of overlap (black). G. Quantification of the average fraction of overlap from each tomogram between indicated ribosome class. P values from Mann-Whitney U test are indicated. *P < 0.05; **P < 0.01; ***P < 0.005; ****P < 0.001.
Figure 4.
Figure 4.. Ribosome-associated protein import alters the local architecture of the outer and inner mitochondrial membranes.
A. Ribosome and membrane model defining co-translation-associated and non-co-translation-associated patches on membrane surface mesh reconstruction for OMM-IMM distance measurement. Co-translation-associated patches (blue) included the nearest OMM triangles (black in the middle of blue patch) to the import-oriented ribosomes and the OMM triangles within 150 Å of these nearest OMM triangles. Non-co-translation-associated patches (gray) consisted of the OMM mesh triangles that excluded co-translation-associated patches. B. Quantification of the peak histogram values of OMM-IMM distance measurements for each tomogram within the indicated membrane patch region. The co-translation-associated and non-co-translation-associated patches are detailed in Figure 4A. The “all membrane” patches represent the entire OMM surface. The “randomized” patches were simulated according to the number of co-translation-associated patches, as outlined in Materials and Methods. P values from Mann-Whitney U test are indicated. *P < 0.05; **P < 0.01; ***P < 0.005; ****P < 0.001. C. Representative membrane surface reconstruction of mitochondria colored by OMM-IMM membrane distance, with regions less than 10 nm shown in blue and regions greater than 10 nm shown in gray. Ribosomes oriented for import relative to the OMM are colored blue, and the remaining ribosomes near but not oriented for import are shown in pink. Insets show zoomed-in boxed regions of the models (middle) and the local variations in OMM-IMM distance (right).

References

    1. Avendaño-Monsalve M. C., Ponce-Rojas J. C. and Funes S. (2020). “From cytosol to mitochondria: the beginning of a protein journey.” Biol Chem 401(6-7): 645–661. - PubMed
    1. Aviram N. and Schuldiner M. (2017). “Targeting and translocation of proteins to the endoplasmic reticulum at a glance.” J Cell Sci 130(24): 4079–4085. - PubMed
    1. Barad B. A., Medina M., Fuentes D., Wiseman R. L. and Grotjahn D. A. (2023). “Quantifying organellar ultrastructure in cryo-electron tomography using a surface morphometrics pipeline.” J Cell Biol 222(4). - PMC - PubMed
    1. Becker T., Bhushan S., Jarasch A., Armache J.-P., Funes S., Jossinet F., Gumbart J., Mielke T., Berninghausen O., Schulten K., Westhof E., Gilmore R., Mandon E. C. and Beckmann R. (2009). “Structure of monomeric yeast and mammalian Sec61 complexes interacting with the translating ribosome.” Science (New York, N.Y.) 326(5958): 1369–1373. - PMC - PubMed
    1. Brandt F., Carlson L. A., Hartl F. U., Baumeister W. and Grünewald K. (2010). “The three-dimensional organization of polyribosomes in intact human cells.” Mol Cell 39(4): 560–569. - PubMed

Publication types

LinkOut - more resources