This is a preprint.
Single-cell transcriptomics reveal differences between chorionic and basal plate cytotrophoblasts and trophoblast stem cells
- PMID: 39071344
- PMCID: PMC11275976
- DOI: 10.1101/2024.07.12.603155
Single-cell transcriptomics reveal differences between chorionic and basal plate cytotrophoblasts and trophoblast stem cells
Abstract
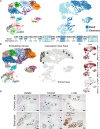
Cytotrophoblast (CTB) of the early gestation human placenta are bipotent progenitor epithelial cells, which can differentiate into invasive extravillous trophoblast (EVT) and multinucleated syncytiotrophoblast (STB). Trophoblast stem cells (TSC), derived from early first trimester placentae, have also been shown to be bipotential. In this study, we set out to probe the transcriptional diversity of first trimester CTB and compare TSC to various subgroups of CTB. We performed single-cell RNA sequencing on six normal placentae, four from early (6-8 weeks) and two from late (12-14 weeks) first trimester, of which two of the early first trimester cases were separated into basal (maternal) and chorionic (fetal) fractions prior to sequencing. We also sequenced three TSC lines, derived from 6-8 week placentae, to evaluate similarities and differences between primary CTB and TSC. CTB clusters displayed notable distinctions based on gestational age, with early first trimester placentae showing enrichment for specific CTB subtypes, further influenced by origin from the basal or chorionic plate. Differential expression analysis of CTB from basal versus chorionic plate highlighted pathways associated with proliferation, unfolded protein response, and oxidative phosphorylation. We identified trophoblast states representing initial progenitor CTB, precursor STB, precursor and mature EVT, and multiple CTB subtypes. CTB progenitors were enriched in early first trimester placentae, with basal plate cells biased toward EVT, and chorionic plate cells toward STB, precursors. Clustering and trajectory inference analysis indicated that TSC were most like EVT precursor cells, with only a small percentage of TSC on the pre-STB differentiation trajectory. This was confirmed by flow cytometric analysis of 6 different TSC lines, which showed uniform expression of proximal column markers ITGA2 and ITGA5. Additionally, we found that ITGA5+ CTB could be plated in 2D, forming only EVT upon spontaneous differentiation, but failed to form self-renewing organoids; conversely, ITGA5-CTB could not be plated in 2D, but readily formed organoids. Our findings suggest that distinct CTB states exist in different regions of the placenta as early as six weeks gestation and that current TSC lines most closely resemble ITGA5+ CTB, biased toward the EVT lineage.
Conflict of interest statement
Declaration of interests Authors declare that they have no competing interests.
Figures


Similar articles
-
Single-cell transcriptomics reveal differences between chorionic and basal plate cytotrophoblasts and trophoblast stem cells.Res Sq [Preprint]. 2025 Jun 11:rs.3.rs-6797967. doi: 10.21203/rs.3.rs-6797967/v1. Res Sq. 2025. PMID: 40585209 Free PMC article. Preprint.
-
Cell trajectory modeling identifies a primitive trophoblast state defined by BCAM enrichment.Development. 2022 Jan 1;149(1):dev199840. doi: 10.1242/dev.199840. Epub 2022 Jan 12. Development. 2022. PMID: 35020896
-
Human pluripotent stem cells as a model of trophoblast differentiation in both normal development and disease.Proc Natl Acad Sci U S A. 2016 Jul 5;113(27):E3882-91. doi: 10.1073/pnas.1604747113. Epub 2016 Jun 20. Proc Natl Acad Sci U S A. 2016. PMID: 27325764 Free PMC article.
-
Trophoblast lineage specification, differentiation and their regulation by oxygen tension.J Endocrinol. 2018 Jan;236(1):R43-R56. doi: 10.1530/JOE-17-0402. J Endocrinol. 2018. PMID: 29259074 Free PMC article. Review.
-
Trophoblast retrieval and isolation from the cervix: origins of cervical trophoblasts and their potential value for risk assessment of ongoing pregnancies.Hum Reprod Update. 2018 Jul 1;24(4):484-496. doi: 10.1093/humupd/dmy008. Hum Reprod Update. 2018. PMID: 29608700 Free PMC article. Review.
References
-
- Huang C. C., Hsueh Y. W., Chang C. W., Hsu H. C., Yang T. C., Lin W. C., and Chang H. M.. Establishment of the fetal-maternal interface: developmental events in human implantation and placentation. Front Cell Dev Biol, 11:1200330, 2023. ISSN 2296–634X. doi: 10.3389/fcell.2023.1200330. Edition: 20230517. - DOI - PMC - PubMed
Publication types
Grants and funding
LinkOut - more resources
Full Text Sources
Molecular Biology Databases
Miscellaneous
