[Preprint]. 2024 Aug 10:2024.05.16.594520.
doi: 10.1101/2024.05.16.594520.

Computational structural prediction and chemical inhibition of the human mitochondrial pyruvate carrier protein heterodimer complex

Affiliations

Computational structural prediction and chemical inhibition of the human mitochondrial pyruvate carrier protein heterodimer complex

Christy M Hadfield et al. bioRxiv. .

Abstract

The mitochondrial pyruvate carrier (MPC) plays a role in numerous diseases including neurodegeneration, metabolically dependent cancers, and the development of insulin resistance. Several previous studies in genetic mouse models or with existing inhibitors suggest that inhibition of the MPC could be used as a viable therapeutic strategy in these diseases. However, the MPC's structure is unknown, making it difficult to screen for and develop therapeutically viable inhibitors. Currently known MPC inhibitors would make for poor drugs due to their poor pharmacokinetic properties, or in the case of the thiazolidinediones (TZDs), off-target specificity for peroxisome-proliferator activated receptor gamma (PPARγ) leads to unwanted side effects. In this study, we develop several structural models for the MPC heterodimer complex and investigate the chemical interactions required for the binding of these known inhibitors to MPC and PPARγ. Based on these models, the MPC most likely takes on outward-facing (OF) and inward-facing (IF) conformations during pyruvate transport, and inhibitors likely plug the carrier to inhibit pyruvate transport. Although some chemical interactions are similar between MPC and PPARγ binding, there is likely enough difference to reduce PPARγ specificity for future development of novel, more specific MPC inhibitors.

Keywords: UK-5099; mitochondria; mitochondrial pyruvate carrier; pyruvate transporter; thiazolidinedione.


Conflict of interest statement

Conflicts of Interest Statement None declared.

Figures
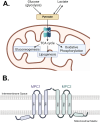
Figure 1:
Figure 1:. MPC’s role in metabolic pathways.
A. The mitochondrial pyruvate carrier (MPC) is an inner mitochondrial membrane protein that transports pyruvate into the mitochondrial matrix. From there, pyruvate carbons can enter the TCA cycle and provide substrates for oxidative phosphorylation or be used in anaplerotic/biosynthetic reactions. B. The human MPC is a heterodimer comprised of MPC1 and MPC2 monomers. Although much is unknown about the structure and orientation of MPC within the inner mitochondrial membrane, it is suspected that each monomer is comprised of three transmembrane domains and an amphipathic N-terminal helix. Figure created with BioRender.com.
Figure 2:
Figure 2:. MPC homology model structural prediction matches bacterial SemiSWEET conformations
A. Predicted MPC heterodimer structure based on homology modeling with crystal structures of the bacterial SemiSWEET transporter. Two models were generated, one from an occluded (O) (PDB: 4QNC) and the other from an outward-facing (OF) (PDB: 4×5N) conformation of the SemiSWEET protein. Orientation within the mitochondrial membrane was predicted based on SemiSWEET orientation. MPC1 monomer is in green and MPC2 monomer is in blue with the N and C-termini labeled. B. Prediction of MPC OF homology model positioning within the membrane predicted by Desmond molecular simulations. Blue represents the aqueous environment and red represents the hydrophobic lipid membrane environment. MPC monomers are colored red (MPC1) and orange (MPC2), respectively. C. TmAlphaFold prediction of the transmembrane regions of each MPC monomer, MPC1 (Uniprot: Q9Y5U8) and MPC2 (Uniprot: O95563). Yellow represents regions predicted to fall within the membrane. The grey discs represent the boundaries of the membrane, and the grey represents regions of the protein that do not fall within the membrane.
Figure 3:
Figure 3:. Schrödinger-modified Alpha-Fold models of the MPC heterodimer complex sample different conformational states.
A. MPC heterodimer complex models generated using AlphaFold2 multimer v3 software, modified by Schrödinger Protein Prep, and relaxed with Amber. Internal pockets predicted by MOLEonline are shown in white. B. The similar models generated using AlphaFold2 multimer v3 and Schrödinger Protein Prep, in unrelaxed conditions. Internal pockets predicted by MOLEonline are shown in white. Models are categorized into the OF, IF, or O conformation based on MOLEonline. C. Superposition of all models, plus overlap of the models in each conformation. Representation on how closely the AlphaFold predicted models match the homology model prediction, grouped by the three conformations as well. The two MPC monomers are represented with different colors in each model with the MPC1 monomer on the left and the MPC2 monomer on the right.
Figure 4:
Figure 4:. SiteMap binding site predictions in MPC structural models reveal five potential ligand binding regions.
A. Homology structural model of MPC complex with SiteMap prediction of binding region. This region aligns with site 1 as seen in Figure 4B. B. In the Schrödinger-prepped AlphaFold predicted models, SiteMap predicted binding regions in five different areas. The first four sites are modeled on structural model O 1.5 unrelaxed and are color coded (Site 1 = blue, site 2 = red, site 3 = magenta, site 4 = yellow). C. A fifth binding site region was identified by SiteMap in two of the AlphaFold predicted models, IF unrelaxed 1.2 and 2.2, shown here in pink. This region is in the center middle of the core as opposed on the outside edges like sites 2 and 4. D. Four of the 21 structural models were chosen for future studies based on their broad coverage of different conformations (OF, IF, and O), the five different binding sites, and different AlphaFold generation parameters. The chosen models are the 1.4 relaxed OF, 1.2 unrelaxed IF, 1.5 unrelaxed O, and 2.3 relaxed OF. Their structures and binding site regions are shown here, along with overlap between all the models, just the models in the OF conformation, or just the models in the IF/O conformation.
Figure 5:
Figure 5:. Certain predicted MPC binding sites are likely invalid.
A. Mitoglitazone docked to binding site 1 in the OF homology model. B. Pioglitazone docked to binding site 2 in OF 2.3 relaxed model. C. Troglitazone docked to binding site 3 in O 1.5 unrelaxed model. D. Troglitazone docked to binding site 4 in O 1.5 unrelaxed model. E. Troglitazone docked to binding site 5 in IF 1.2 unrelaxed model. A graphical representative of the different binding sites mapped to the MPC complex allows for orientation of the different three-dimensional models in space. F. Representation of physical locations of all 5 binding sites.
Figure 6:
Figure 6:. Different chemical group interactions required for MPC binding over PPARγ binding.
The following different arrow colors represent different interactions between the docked ligands and proteins. Red = Pi-cation interactions. Yellow = Pi-pi interactions. Blue = hydrogen bond formation. Purple = salt bridge formation. A. Interactions for binding between UK-5099, Rosiglitazone, Ciglitazone, Pioglitazone, Troglitazone, Mitoglitazone, Azemiglitazone, and MPC vs. PPARγ.
Figure 7:
Figure 7:. Vital residues imply larger binding pocket than predicted
A. Pioglitazone, in green, docked to OF 2.3 relaxed binding site 1. In grey are three previously predicted residues critical for the binding and function of substrates and inhibitors. B. Troglitazone, in green, docked to IF 1.2 unrelaxed binding site 5. In grey are three previously predicted residues critical for the binding and function of substrates and inhibitors. These grey residues are Phe66 on MPC1, and Lys49 and Asn100 on MPC2. C. Percent representation of how often different MPC amino acids are involved in binding in the different OF and IF models. Pie chart pieces coming out of the graph represent three amino acid residues that were present in each binding model (both OF site 1 and IF site 5).

References

    1. Nagampalli R. S. K., Quesnay J. E. N., Adamoski D., Islam Z., Birch J., Sebinelli H. G., Girard R., Ascencao C. F. R., Fala A. M., PauleK B. A., Consonni S. R., de Oliveira J. F., Silva A. C. T., Franchini K. G., Leme A. F. P., Silber A. M., Ciancaglini P., Moraes I., Dias S. M. G., Ambrosio A. L. B., Sci Rep 2018, 8, 3510. - PMC - PubMed
    1. Tavoulari S., Schirris T. J. J., Mavridou V., Thangaratnarajah C., King M. S., Jones D. T. D., Ding S., Fearnley I. M., Kunji E. R. S., Mol Metab 2022, 60, 101469. - PMC - PubMed
    1. Lee J., Jin Z., Lee D., Yun J. H., Lee W., Int J Mol Sci 2020, 21.
    1. Tavoulari S., Sichrovsky M., Kunji E. R. S., Acta Physiol (Oxf) 2023, 238, e14016. - PMC - PubMed
    1. Oonthonpan L., Rauckhorst A. J., Gray L. R., Boutron A. C., Taylor E. B., JCI Insight 2019, 5. - PMC - PubMed

Publication types