[Preprint]. 2024 Jul 15:2024.07.10.602774.
doi: 10.1101/2024.07.10.602774.

Coordinated Response Modulations Enable Flexible Use of Visual Information

Affiliations

Coordinated Response Modulations Enable Flexible Use of Visual Information

Ramanujan Srinath et al. bioRxiv. .

Abstract

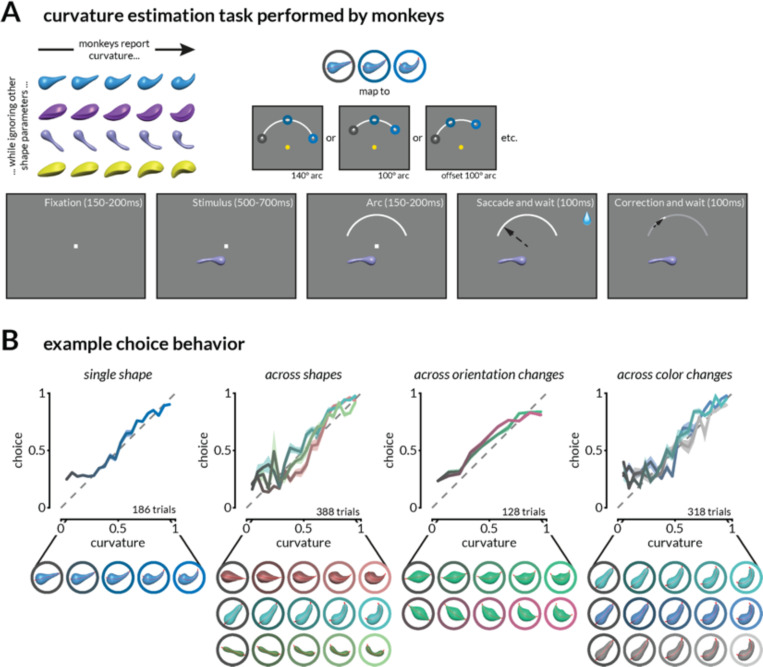
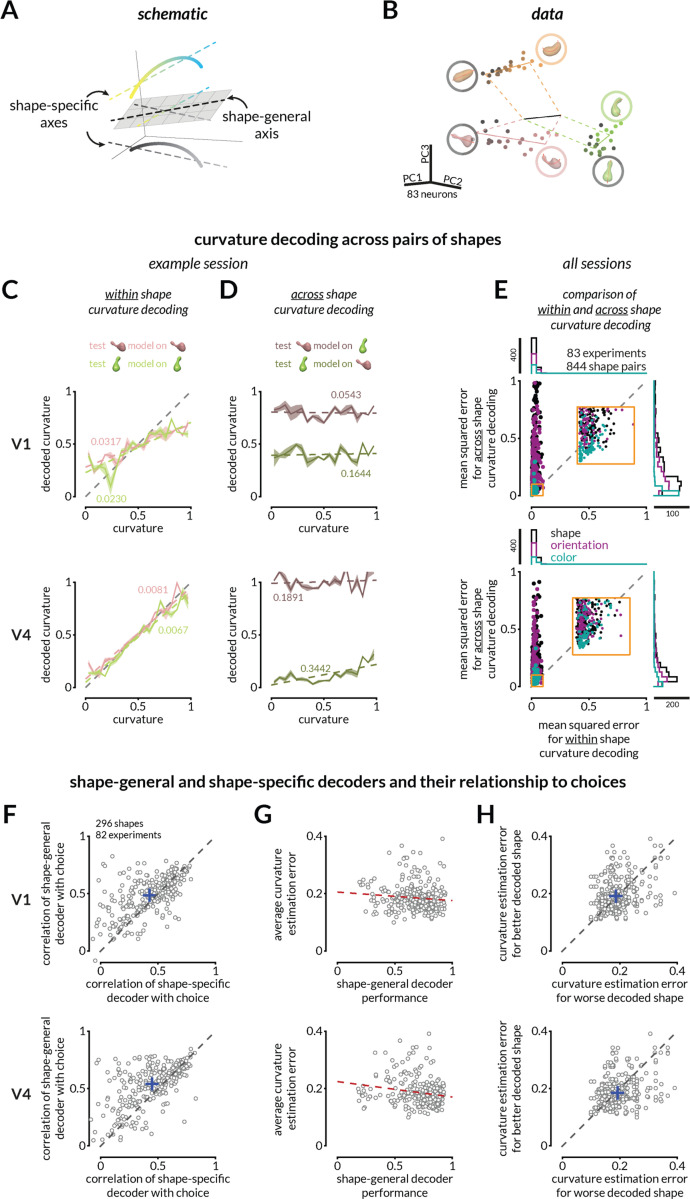
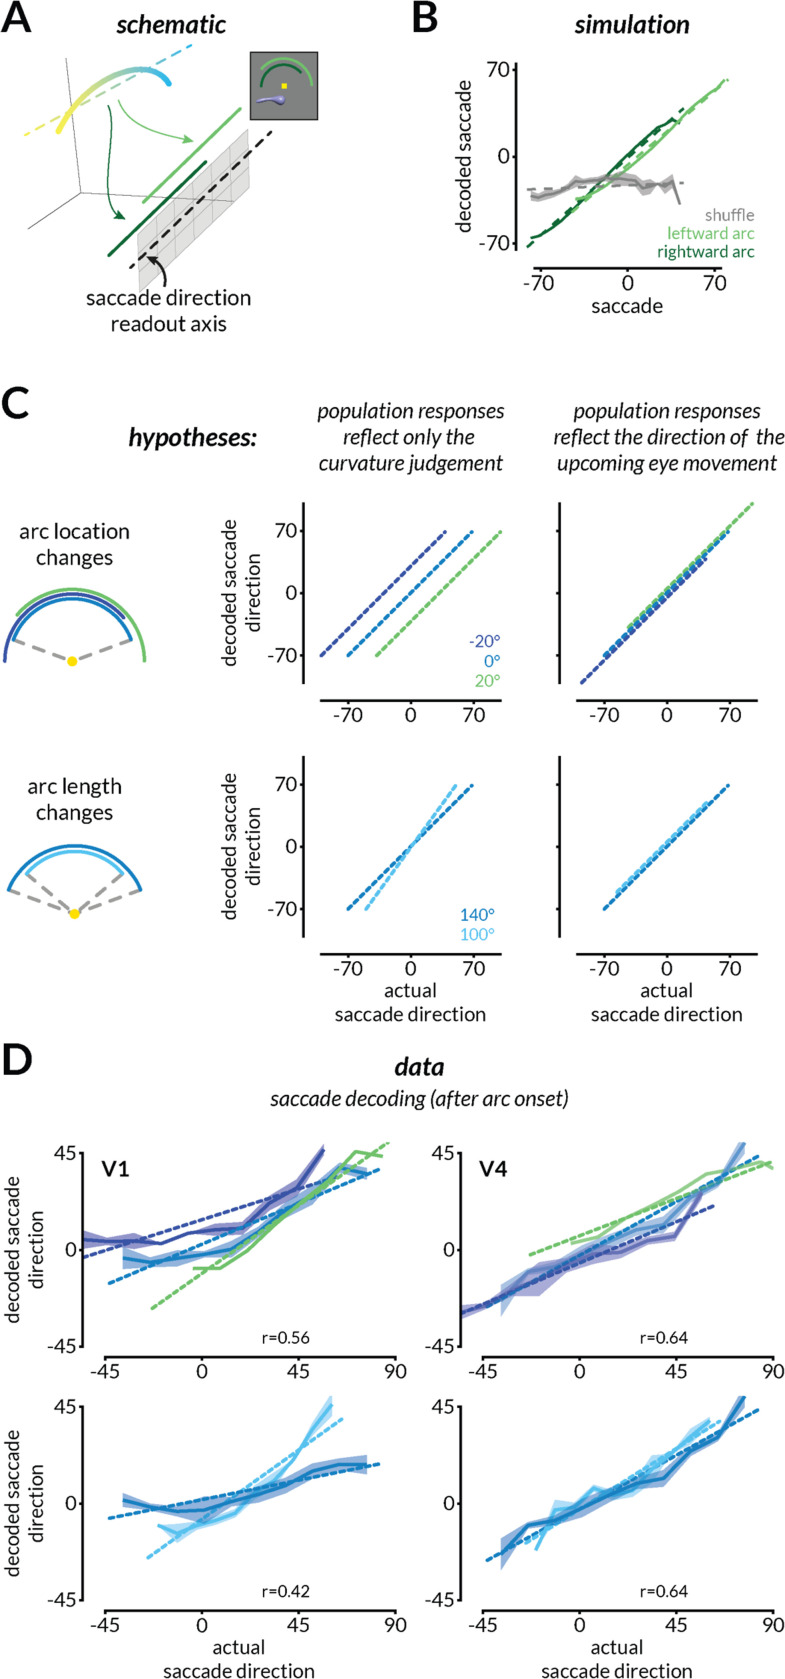
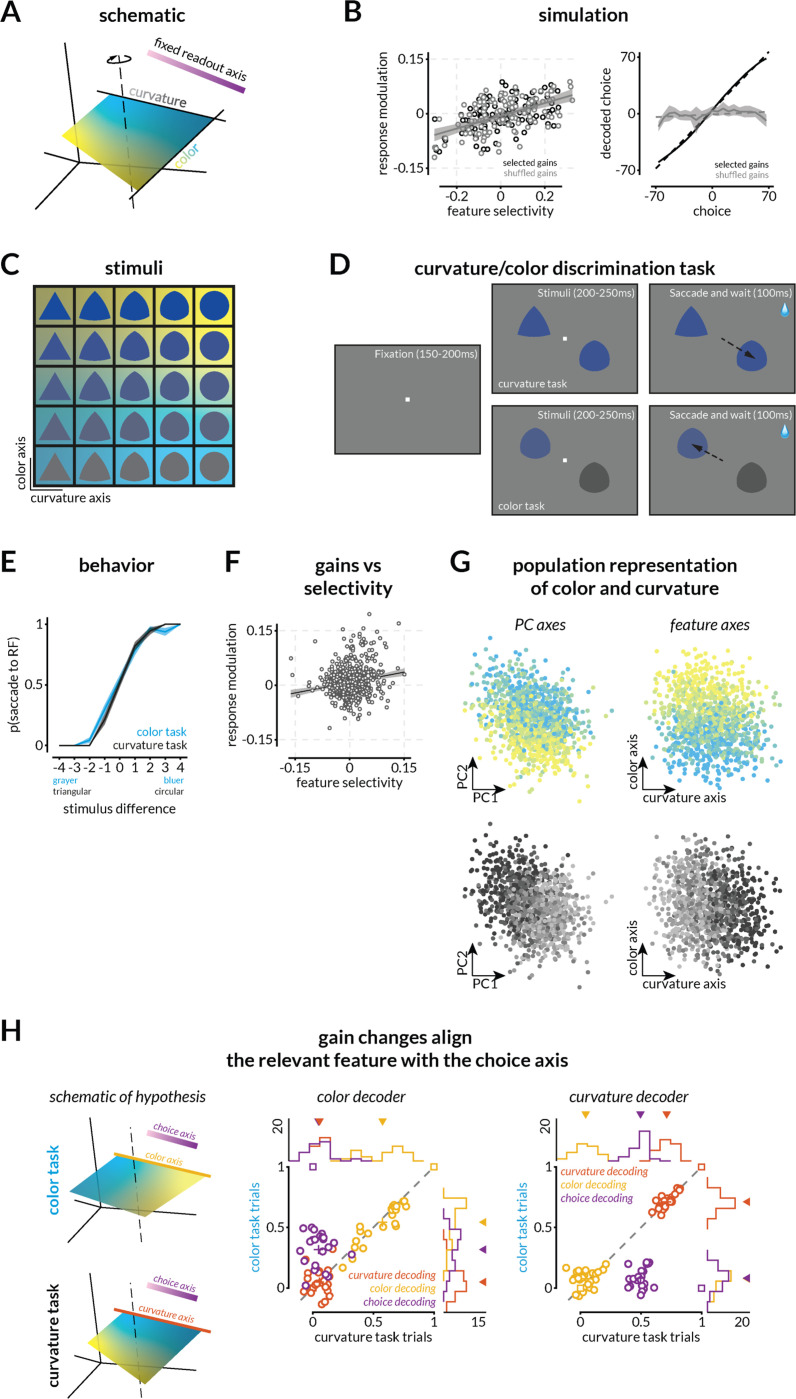
We use sensory information in remarkably flexible ways. We can generalize by ignoring task-irrelevant features, report different features of a stimulus, and use different actions to report a perceptual judgment. These forms of flexible behavior are associated with small modulations of the responses of sensory neurons. While the existence of these response modulations is indisputable, efforts to understand their function have been largely relegated to theory, where they have been posited to change information coding or enable downstream neurons to read out different visual and cognitive information using flexible weights. Here, we tested these ideas using a rich, flexible behavioral paradigm, multi-neuron, multi-area recordings in primary visual cortex (V1) and mid-level visual area V4. We discovered that those response modulations in V4 (but not V1) contain the ingredients necessary to enable flexible behavior, but not via those previously hypothesized mechanisms. Instead, we demonstrated that these response modulations are precisely coordinated across the population such that downstream neurons have ready access to the correct information to flexibly guide behavior without making changes to information coding or synapses. Our results suggest a novel computational role for task-dependent response modulations: they enable flexible behavior by changing the information that gets out of a sensory area, not by changing information coding within it.


Conflict of interest statement

Conflict of Interest: The authors declare no competing financial interests.

Figures

Figure 1:
Figure 1:. Task and behavior
A. Schematic of the continuous curvature estimation task. Stimuli that varied in curvature and task-irrelevant features were presented in the joint receptive fields of V1 and V4 neurons as monkeys fixated a central dot. After 550–800ms, a target arc was presented in the upper hemifield, and monkeys were rewarded for making a saccade to a location on the arc that corresponded to the stimulus curvature. The reward amount was inversely related (with a threshold) to the error in curvature judgment. In a subset of experiments, the radial position, angular position, and length of the target arc were varied pseudorandomly. B. Monkeys report medial axis curvature while ignoring other stimulus features. Example continuous estimation behavior on four sessions during which the curvature of one or many shapes was estimated on interleaved trials. Shading indicates the standard error of the mean (SEM).
Figure 2:
Figure 2:. The monkeys’ behavior suggests that a fixed linear combination of neural responses explains curvature judgments across many irrelevant stimulus changes.
A. The representations of curvature for different shapes can be misaligned but a common shape-general axis can represent curvature. B. For illustration purposes, V4 population responses to three shapes (varying in curvature) recorded on interleaved trials are projected into the first three principal components of the space in which the response of each simultaneously recorded neuron is one dimension. The points indicate the average population response to each unique stimulus at each curvature value. Luminance of the points (black to pink, green, or orange) represents increasing curvature. Solid colored lines represent best fit lines for each shape (shape-specific axis), and the black line represents the shape-general axis (see Figure S4 for other examples). C. Curvature can be linearly decoded (cross-validated) from V1 (top) and V4 (bottom) responses for each shape independently for the example session in B. Colored labels indicate mean squared error (MSE) between the actual and predicted curvatures, and colored lines depict the linear fit relating predicted and actual curvatures. Shading indicates SEM across 100 folds of 50% trial splits (see Figure S4 for more example decoding analyses.) D. The representations of curvature are not aligned across shapes. Same decoders as C, but the linear decoder is trained on responses to one shape and tested on responses to another in V1 (top) or V4 (bottom). E. Curvature representations for different shapes are typically misaligned. Across shape pairs, our ability to decode curvature from V1 (top) and V4 (bottom) is better when the weights are based on responses to the same shape (x-axis) than when it is based on responses to the other shape in the pair (y-axis); MSE for same shape decoding from V1 responses (left) and V4 responses (right) is smaller than for across shapes (Wilcoxon rank sum test; p < 10−10). Each dot indicates a shape pair that is different in overall shape appearance (black), orientation only (purple), or color only (teal). The inset is a zoomed in view of the indicated area on the plot. The marginal distributions are shown on the top and right. F. The monkeys’ choices are more strongly correlated with the prediction of a shape-general linear combination of neural responses (as in C) than a shape-specific strategy for V1 (top) and V4 (bottom) (Wilcoxon signed rank tests; p<10−8 V1; p<10−14 V4). Each point represents the correlation values (between the decoded curvature and the monkey’s choice) for one shape. G. Behavioral choices are more accurate (lower average absolute error) for shapes whose representation is well-aligned with the shape-general curvature decoder of V4 (bottom) responses (correlation r= –0.17, vs constant model p=0.003), but not significantly for V1 (correlation r= –0.07, vs constant model p=0.261). H. For pairs of shapes tested in the same session, average behavioral error was typically bigger for the worse decoded shape (using a shape-general decoder; x-axis) than the better decoded shape (y-axis) in V4 (Wilcoxon signed rank test; V4: p=0.004), but not significantly for V1 (p=0.19).
Figure 3:
Figure 3:. V4, but not V1, population activity is reformatted to enable the flexible mapping of curvature to different actions.
A. To enable a flexible mapping between curvature judgments and eye movement responses, the curvature representation of a shape could be transformed to align with a fixed readout axis that communicates with eye movement planning areas. In other words, the same curvature judgment should be mapped to different parts of the saccade direction axis depending on the location and length of the arc. B. In simulations, we randomly assigned the arc-dependent gain modulations to neurons by drawing from a distribution of response gains that is consistent with single neuron results (see Methods). Only some draws of the same distribution enabled the mapping of curvature representations to the appropriate portions of the readout axis such that the saccade could be decoded from the population (light and dark green). Most other draws did not (gray). C. Schematic depicting analyses that would reveal whether neural population responses reflect only the curvature judgment and not the upcoming eye movement used to communicate that judgment (left) or whether they also reflect the upcoming eye movement (right). Colors represent predictions for the different arc locations (top) or lengths (bottom). D. V4, but not V1, responses reflect the direction of the upcoming eye movement in example sessions. The impending saccade direction was decoded from V1 (left) and V4 (right) responses during the period when the monkeys have not yet moved their eyes but after the onset of the arc that allows them to plan the eye movement. Shading indicates SEM and the correlation between actual and predicted saccade direction is labeled on the bottom-right of each panel.
Figure 4:
Figure 4:. Small gain changes consistent with feature attention or surround modulation enable different visual features to guide choices.
A. Schematic of the hypothesis that gain changes will reformat stimulus representations to align with a fixed readout axis depending upon the relevant feature. B. Small gain changes can, but do not necessarily transform the population response to enable different features to guide choices. Similar to Figure 3, we simulated neurons tuned to two features and assigned small gains to each neuron by drawing from a distribution similar to the distribution of gains that have been reported for feature attention(22). Some random draws transform the population such that the representation of the task-relevant feature is aligned with the readout axis (black). As in the previous simulation, many random draws from the same distributions (black vs gray points; left) do not (gray; right). C. Stimuli varied in color/luminance (blue to gray) and curviness/shape (triangle to circle). Background colors allow comparison to neural results in G and H. D. Schematic of the two-feature (curvature/color) discrimination task. The monkey was rewarded for making a saccade to one of the stimuli (one in the joint receptive fields of the recorded V4 neurons and one in the opposite hemifield). During the curvature task, the colors of the two stimuli were the same (selected from the same row in C) and the more circular stimulus was rewarded. During the color task, the stimuli were the same (selected from the same column in C) and the bluer stimulus was rewarded. E. Example psychometric curves for the curvature (black) and color (blue) task. The plot depicts the proportion of trials in which the monkey chose the stimulus in the receptive fields of the recorded V4 neurons as a function of the relevant feature of the stimulus that was in that receptive field. These data are from a single experimental session (314 total trials, 89% correct overall; 176 color task trials, 89% correct; 138 shape task trials, 90% correct). Across the 23 sessions that were used for further analysis, during which curvature and color task trials were randomly interleaved, the monkey performed at 85.45% correct overall (~ 610 trials on average per session), 79.54% on the color task, and 91.65% on the shape task. F. Replication of previous results showing a relationship between the modulation of neural responses associated with the different tasks and the selectivity of the neuron to the two features. The linear fit (R2=0.032; intercept=0.007 (p<10−11); slope=0.19 (p<10−8)) and 95% confidence intervals are indicated by black line and gray shaded region. G. Population representation of the two stimulus features using PCA (left) and QR decomposition (right) to visualize the representations of color (blue to yellow gradient) and shape (black to gray gradient) of the image in the population RF. Each point is the V4 population response on one trial. H. Evidence that task-dependent gains reformat neural representations to enable flexibility in which feature guides choices (left). The middle and right plots depict correlations between the values predicted by the linear combination of V4 responses that best predicts color (left) or curvature (right) and the actual values of shapes, colors, and choices in the color (y-axes) or curvature task trials (x-axes). Across both tasks, shape and color are decoded well on the shape and color axes respectively, but not vice versa, suggesting that the two features are approximately orthogonally represented in neural population space. As predicted by the simulations (square markers), on color task trials, we could decode the animal’s choices significantly better on the color than on the shape axis (Wilcoxon signed rank test, p<10−4), and on shape trials, we could decode choices significantly better on the shape than the color axis (Wilcoxon signed rank test, p<10−4). Marginal histograms with arrows indicating means are shown at the top and right of both panels (black line and the number indicate the experiment count).

References

    1. Maunsell J. H. R., Neuronal Mechanisms of Visual Attention. Annu. Rev. Vis. Sci. 1, 373–391 (2015). - PMC - PubMed
    1. Xue C., Kramer L. E., Cohen M. R., Dynamic task-belief is an integral part of decision-making. Neuron 110, 2503–2511.e3 (2022). - PMC - PubMed
    1. Stringer C., Pachitariu M., Steinmetz N., Reddy C. B., Carandini M., Harris K. D., Spontaneous behaviors drive multidimensional, brainwide activity. Science 364, eaav7893 (2019). - PMC - PubMed
    1. Treue S., Neural correlates of attention in primate visual cortex. Trends Neurosci. 24, 295–300 (2001). - PubMed
    1. Hayden B., Gallant J., Working Memory and Decision Processes in Visual Area V4. Front. Neurosci. 7 (2013). - PMC - PubMed

Publication types

LinkOut - more resources