[Preprint]. 2024 Dec 21:2024.07.19.604309.
doi: 10.1101/2024.07.19.604309.

Developmental timecourse of aptitude for motor skill learning in mouse

Affiliations

Developmental timecourse of aptitude for motor skill learning in mouse

Taehyeon Kim et al. bioRxiv. .

Abstract

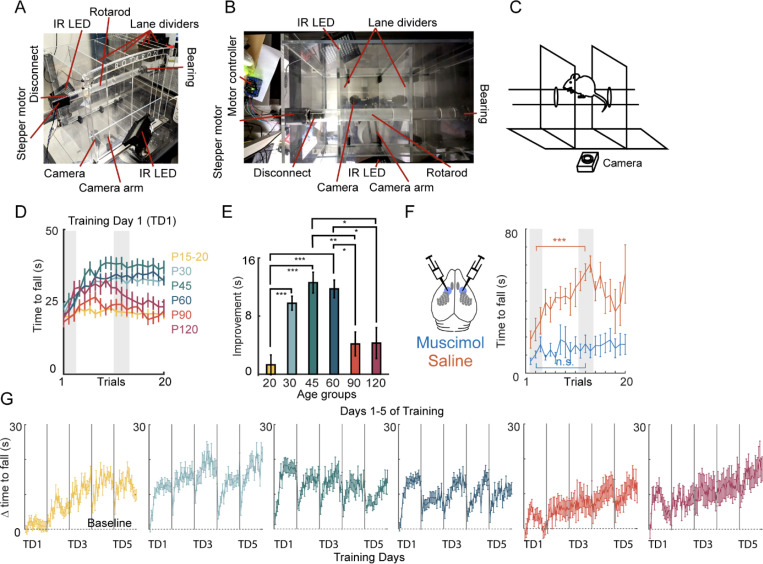
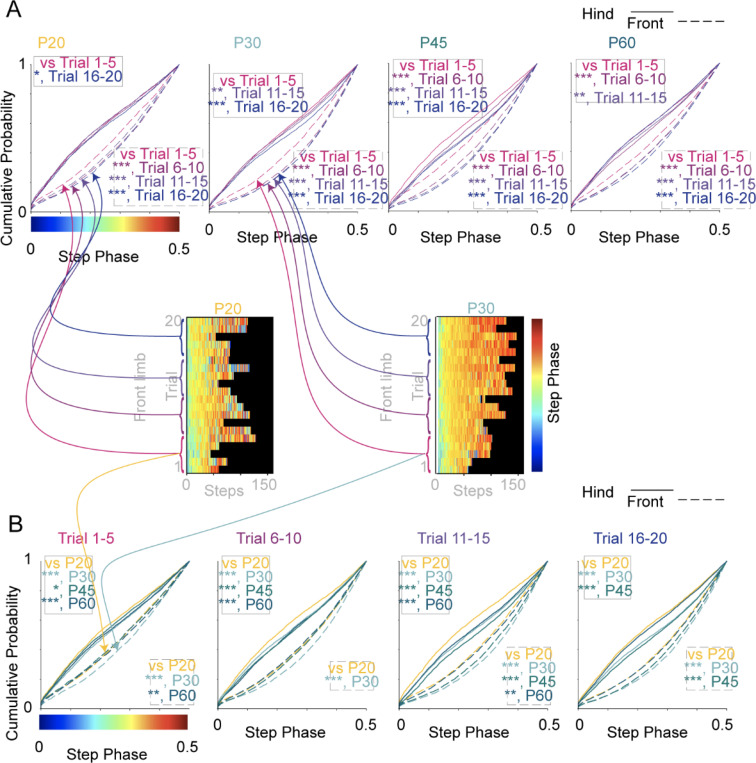
Learning motor skills requires plasticity in the primary motor cortex (M1). But the capacity for cortical circuit plasticity varies over developmental age in sensory cortex. This study assesses the normal developmental trajectory of motor learning to assess how aptitude might vary with age. We trained mice of both sexes to run on a custom accelerating rotarod at ages from postnatal day (P) 20 to P120, tracking paw position and quantifying time to fall and changes in gait pattern. While animals of all ages were able to perform better after five training sessions, performance improved most rapidly on the first training day for mice between ages P30-60, suggesting an age with heightened plasticity. Learning this task required M1, because pharmacological inactivation of M1 prevented improvement in task performance. Paw position and gait patterns changed with learning, though differently between age groups. Successful mice learned to shift their gait from hopping to walking. Notably, this shift in gait happened earlier in the trial for forelimbs in comparison to hindlimbs. Thus, motor plasticity might more readily occur in forelimbs. Changes in gait and other kinematic parameters are an additional learning metric beyond time to fall, offering insight into how mice improve performance. Overall, these results suggest mouse motor learning has a developmental trajectory.


Conflict of interest statement

Conflict of interest statement: The authors declare no competing financial interests.

Figures

Figure 1 |
Figure 1 |. Rotarod skill acquisition plateaus around P30-P60 on training day 1.
(A) Image of a clear plexiglass rotarod with high speed video. Steeper motor and camera run by computer adjacent to the operator. Multiple lanes are possible (divided by moveable lane dividers) to simultaneously run multiple mice (two lanes in the camera field of view). Infrared (IR) LEDs used for illumination during behavioral training. (B) Overhead view of the apparatus. Lane dividers opened further than during trials to illustrate capacity for sliding. (C) Schematic of rotarod task with high speed videography and barriers to create the running lane during a trial. (D) Video frame of mouse during running. Paw positions (LFP, left front paw; LHP, left hind paw; RFP, right front paw; RHP, right hind paw) and the nose and tail base are tracked using DeepLabCut. (E) Learning curve during 20 trials on training day 1 (TD1). Six colors represent the six ages tested (P15–20, P30, P45, P60, P90, and P120). Gray bars represent time windows used for early and late performance to assess TD1 improvement. (F) Improvement (in seconds) in time to fall during TD1 for six age groups. Mean+/− SEM. N=63, 92, 60 63, 27, 12. The effect of M1 inactivation by bilateral muscimol injection on rotarod skill acquisition compared to saline injected controls. N=5 (control); N=9 (muscimol). Mean+/− SEM. Significance: *, p<0.05; **, p<0.01; ***, p<0.001. (G) Improvement (in seconds) in time to fall during five training days.
Figure 2 |
Figure 2 |. Developmental changes in mobility and weight do not account for rotarod performance
(A) Measurement of home cage walking (beam breaks) used to assess motility across developmental ages. (B) Home cage motility quantified by sex across ages. Red/blue is used to designate sex (red, female; blue, male), with brightness used to indicate age. The same color scheme is used in D-E. (C-D) Changes in weight across developmental ages, quantified for all mice or by sex. Male mice weigh more than female mice at ages older than P30. (E) Plot comparing the first training day (TD1) time-to-fall improvement versus weight. Red/blue color code is used to indicate age and sex. Linear fit is relatively poor (R2=−0.04). (F) Weight vs. improvement data separated by age. Significance: *, p<0.05; **, p<0.01; ***, p<0.001.
Figure 3 |
Figure 3 |. Developmental changes in rotarod performance plotted for male and female
(A) Measurement of training day 1 (TD1) performance, separated by male (blue) and female (red). (B) Summary of time-to-fall improvement, plotted as in Figure 1. (C) Measurement of rotarod performance across all training days, separated by male (blue) and female (red). Significance: *, p<0.05; **, p<0.01; ***, p<0.001.
Figure 4 |
Figure 4 |. Tracking step kinematics during rotarod training.
(A) Schematic of rotarod task with video frame of tracked mouse. (B) Cartoon of tracked image frame illustrating location of the mouse paws (LFP, left front paw; LHP, left hind paw; RFP, right front paw; RHP, right hind paw), the nose, and tail base using DeepLabCut. The rotarod and direction of motion are indicated, with the front and rear ends of the rod serving as 0.0 and 1.0 in normalized coordinates. At bottom, coordinates for the step start, step end, and step length are plotted to illustrate how they are determined. (C) Plot of the x-position of a single paw (LHP, left) or all paws (right) during a trial. Time given in frames (converted to seconds with example timebar). (D) Expansion of paw tracker showing step detection. Steps (red) are automatically detected (see methods). Step start (green), step end (black), and step length are then calculated. (E) Step length versus time to fall for the left front paw, plotted for individual ages (20 and above). Data are fit to a line and the linear fit compared at right. Summary plots include step length versus time to fall for the right front paw, left hind paw, and right hind paw (far right). Pearson correlation coefficients (PCC) and coefficient of determination (R²) are given, along with the statistical significance of the correlation (**, p<0.01, ***, p<0.001). (F) Step end point presented similarly to step length.
Figure 5 |
Figure 5 |. Gait pattern changes with age and training.
(A) Schematic of paw tracking during alternating gait/walking (top) or simultaneous gait/hopping (bottom), with front (LFP, RFP) and hind (LHP, RHP) paws tracked. (B) Using the hind paws to illustrate, LHP (green) and RHP (steps are shown, with vertical lines incidating step start times. (C) The step start times for one foot are scaled from 0.0 (when the first LHP step begins) to 1.0 (when the next LHP step begins) and the timing of the RHP step assigned a value from 0.0 to 1.0 (in the top example, 0.49). The color map at bottom indicates the color to be used in the subsequent plot to illustrate phase (with red representing 0.5/alternation and blue for 0.0/simultaneity). The step phase map is mirrored for values ranging from 0.5–1.0. (D) Overall gait pattern is plotted by limb (front limb, top; hind limb, bottom) and age (from left to right, panels for P20 to P60). Within each panel, the rows represent trials on training day 1 with the bottom row as trial 1 and the top row as trial 20. For each step, starting with the first step taken, step phase is plotted as the average across all mice in that condition. The number of steps included in the average thus varied across the row for each trial (when some mice fall off the rod).
Figure 6 |
Figure 6 |. Statistical comparison of gait pattern changes across trials and ages.
(A) Cumulative probability plots for the data in Fig. 5D to compare step phase across trial number (in groups of Trials 1–5, 6–10, 11–15, and 16–20). Dashed line represents front paws; solid line represents hind paws. (B) Cumulative probability plots for the data in Fig. 5D to compare step phase across age (in groups of P20, P30, P45, and P60). Dashed line represents front paws; solid line represents hind paws. Cartoon illustrates the categories from which the individual step data is drawn to make the cumulative probability plot. The step data is averaged across mice in Fig. 5D, but here each individual step phase value is used. Significance: *, p<0.05; **, p<0.01; ***, p<0.001.
Figure 7 |
Figure 7 |. Visual representations of p-values for the gait analysis.
(A) Due to variations in the number of steps, the number of steps in a trial were divided into deciles to facilitate the comparison of average step phases across trials and age groups. The average step phase value for each age for front and hind limbs is plotted. (B) The P-value plot of deciles compares the first decile of trials 1–20 to rest of the deciles (2–9) for each trial. The top row compares front paws at four ages and the bottom row compares hind paws. Non-significant p-values are purple; p-values < 0.05 are as shown in the lookup table. (C) The P-value plot comparing across trials compares each decile from trials 2–20 with the corresponding decile from trial 1. The top row compares front paws at four ages and the bottom row compares hind paws. For instance, the front paw in P20 Decile 3 from trial 3 is compared to Decile 3 from trial 1. Non-significant p-values are purple; p-values < 0.05 are as shown in the lookup table. (D) The P-value plot of deciles compared across ages assess P20 versus P30, P45, and P60 groups for 20 trials. Each individual graph represents the comparison between the four age groups for a given trial. The X-axis denotes deciles, with a specific trial’s decile being compared to the corresponding decile of the P20 group. For example, the front paw in P30 Decile 9 is compared to P20 Decile 9 in the trial 1 graph, and if significantly different, it is indicated by a bump in the y-axis. Significance: *; p<0.05. **;p<0.01, ***;p<0.001.

Similar articles

References

    1. Adler A, Zhao R, Shin ME, Yasuda R, Gan W-B (2019) Somatostatin-Expressing Interneurons Enable and Maintain Learning-Dependent Sequential Activation of Pyramidal Neurons. Neuron 102:202–216.e7 - PMC - PubMed
    1. Alia C, Spalletti C, Lai S, Panarese A, Micera S, Caleo M (2016) Reducing GABA A-mediated inhibition improves forelimb motor function after focal cortical stroke in mice. Sci Rep. 6: 37823. - PMC - PubMed
    1. Bachtiar V, Stagg CJ (2014) The role of inhibition in human motor cortical plasticity. Neuroscience 278:93–104. - PubMed
    1. Blicher JU, Near J, Næss-Schmidt E, Stagg CJ, Johansen-Berg H, Nielsen JF, Østergaard L, Ho YCL (2015) GABA levels are decreased after stroke and GABA changes during rehabilitation correlate with motor improvement. Neurorehabil Neural Repair 29:278–286. - PMC - PubMed
    1. Buitrago MM, Schulz JB, Dichgans J, Luft AR (2004) Short and long-term motor skill learning in an accelerated rotarod training paradigm. Neurobiol Learn Mem 81:211–216. - PubMed

Publication types

LinkOut - more resources