[Preprint]. 2024 Jul 18:2024.07.17.604015.
doi: 10.1101/2024.07.17.604015.

Rapid protein evolution by few-shot learning with a protein language model

Affiliations

Rapid protein evolution by few-shot learning with a protein language model

Kaiyi Jiang et al. bioRxiv. .

Abstract

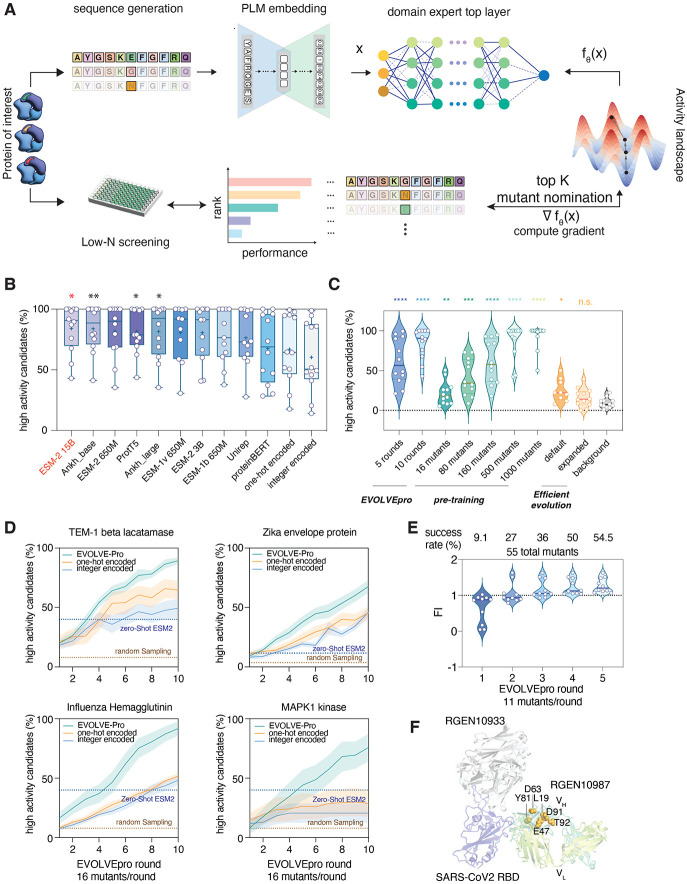
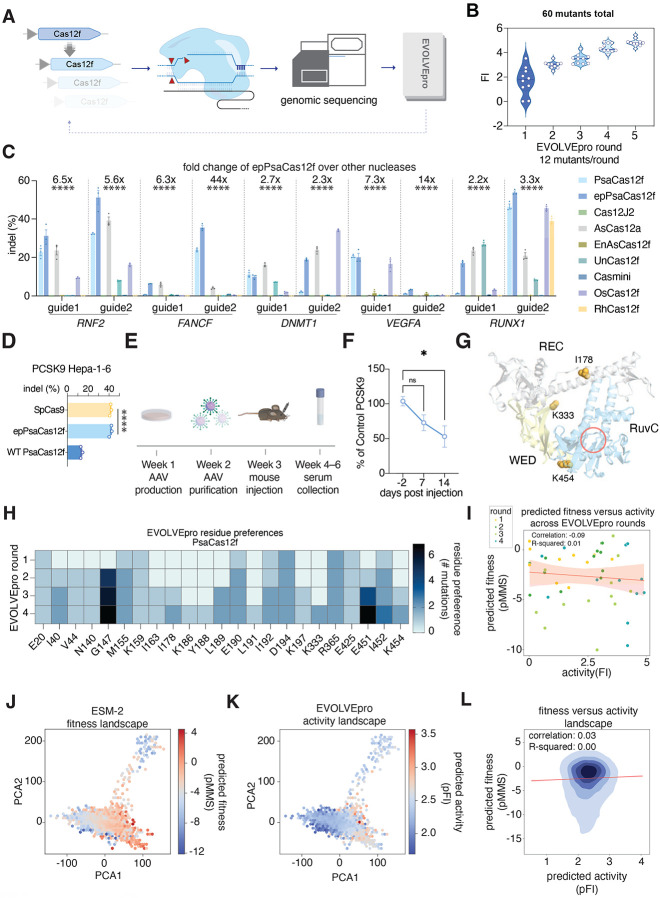
Directed evolution of proteins is critical for applications in basic biological research, therapeutics, diagnostics, and sustainability. However, directed evolution methods are labor intensive, cannot efficiently optimize over multiple protein properties, and are often trapped by local maxima. In silico-directed evolution methods incorporating protein language models (PLMs) have the potential to accelerate this engineering process, but current approaches fail to generalize across diverse protein families. We introduce EVOLVEpro, a few-shot active learning framework to rapidly improve protein activity using a combination of PLMs and protein activity predictors, achieving improved activity with as few as four rounds of evolution. EVOLVEpro substantially enhances the efficiency and effectiveness of in silico protein evolution, surpassing current state-of-the-art methods and yielding proteins with up to 100-fold improvement of desired properties. We showcase EVOLVEpro for five proteins across three applications: T7 RNA polymerase for RNA production, a miniature CRISPR nuclease, a prime editor, and an integrase for genome editing, and a monoclonal antibody for epitope binding. These results demonstrate the advantages of few-shot active learning with small amounts of experimental data over zero-shot predictions. EVOLVEpro paves the way for broader applications of AI-guided protein engineering in biology and medicine.


Figures

Fig. 1.
Fig. 1.. Developing and benchmarking EVOLVEpro for protein language model-guided engineering.
(A) Schematic describing the EVOLVEpro method. Proteins of interest go through iterative rounds of low-N screening. A foundational PLM generates embeddings for all mutants of a protein and the average embedding by pooling across all residues is used as input for the top-layer model. Each mutant’s activity is experimentally determined and used to train a domain expert top-layer model with PLM embedding as input. The top-layer model then nominates the top-N mutants for the next round of testing and the weights are updated iteratively in an active learning format. (B) Benchmarking of foundational models across a panel of 12 comprehensive deep mutational scanning (DMS) datasets. Each point is a unique protein and its DMS data. ESM2-15B has the highest average percent success in high activity variants prediction. (C) Comparison between EVOLVEpro in active learning format, in zero-shot pretraining format, and an existing zero-shot prediction method using protein language model (6) across 12 DMS datasets. Each point is a unique protein using its DMS data. (D) Performance over 10 rounds of EVOLVEpro with 16 mutants per round, compared to two different non-language model encoding schemes (one-hot encoding and integer encoding). Model performance is benchmarked on four datasets(17, 22, 26, 54) and compared to zero-shot ESM2 nomination success rate and background random sampling (6). Error bar represents the standard deviation for n=10 random simulations. (E) Engineering of REGN10987 over five rounds of EVOLVEpro. Data shows cumulative top 10 mutants’ fold improvement over wild-type binding affinity to the target antigen across 5 evolution rounds. Percentages show the percent of mutants that have higher activity than wild-type REGN10987 each round. (F) Mapping of the top mutations on the structure of REGN10987 (PDB: 6XDG).
Fig. 2.
Fig. 2.. Evolution of highly active miniature CRISPR nucleases with EVOLVEpro.
(A) Schematic of the evolution strategy with EVOLVEpro for engineering a miniature Cas12f. (B) Engineering of PsaCas12f over four rounds of EVOLVEpro and a rational combination multi-mutant round. Data shows cumulative top 10 mutants from current and preceding rounds, as measured by fold improvement of indel activity at the endogenous RNF2 genomic locus. (C) Indel activities of WT PsaCas12f, epPsaCas12f, and a panel of published Cas12a and Cas12f nucleases on 10 different genomic targets across five genes (two guides per gene). The fold change on top of each guide denotes the relative fold increase of epPsaCas12f compared to the average of the other published Cas12a and Cas12f nucleases. A one-way ANOVA is performed for each guide sequence shown (****, p<0.0001). (D) Next-generation sequencing quantified indel formation at murine PCSK9 genomic loci by epPsaCas12f, WT PsaCas12f, and SpCas9. A one-way ANOVA is performed for each guide sequence shown (****, p<0.0001). (E) Schematic of the in vivo validation assay for EnPsaCas12f editing at the murine PCSK9 locus for PCSK9 reduction. (F) Serum PCSK9 levels at three different time points from −2 days of injection to +14 days. The percent of control PCSK9 was calculated by normalizing to the control group with PBS injected. A two-sided Student’s t-test was run on each time point relative to −2 days’ baseline PCSK9 level (ns, non-significant, *, p<0.05). (G) Mapping of the top mutations on the AlphaFold3 model of PsaCas12f. The RuvC active site is indicated by a red circle. (H) Heatmap showing most common PsaCas12f mutations explored by EVOLVEpro over rounds of evolution. Any position explored more than once is shown on a cumulative basis across rounds. (I) Scatter plot comparing the predicted naive ESM-2 protein fitness (predicted masked marginal score) and scaled tested activity of nominated mutants across evolution, scatter points are colored by rounds in evolution. (J-K) Comparison of the PsaCas12f embedding latent space with either predicted naive ESM-2 protein fitness landscape or EVOLVEpro protein activity landscape. (L) A kernel density estimate plot of protein fitness as predicted by ESM-2 versus protein activity as predicted by EVOLVEpro. The correlation and linear regression line are shown in red and the R square of the correlation is reported.
Fig. 3.
Fig. 3.. Evolution of prime editor with EVOLVEpro.
(A) Schematic of the evolution strategy with EVOLVEpro for engineering a prime editor to be more efficient in attB insertion. (B) Engineering of the prime editor PE2 with twinPE guides over seven rounds of EVOLVEpro. Data shows cumulative top 10 mutants from current and preceding rounds, as measured by fold improvement of prime editing activity to install a 46 bp AttB site at the murine NOLC1 genomic locus. (C) Validation of 4 evolved prime editors in the installation of attB sites at four different endogenous sites in either mouse or human genomes. A two-sided unpaired t-test was run between WT and each evolved prime editor (ns, non-significant, *, p<0.05, **, p<0.01, ***, p<0.001, ****, p<0.0001). Fold change over wild-type PE2 is shown for the best mutant on each genomic locus. Error bars represent standard deviation with n=3 biological replicates. (D) Mapping of the top mutations on the AlphaFold3 model of M-MLV RT. The RT active site is indicated by a red circle. (E) Heatmap showing most common PE2 mutations explored by EVOLVEpro over rounds of evolution. Any position explored more than once is shown on a cumulative basis across rounds. (F) Scatter plot comparing the predicted naive ESM-2 protein fitness (predicted masked marginal score) and scaled tested activity of nominated mutants across evolution, scatter points are colored by rounds in evolution. (G-H) Comparison of the PE2 embedding latent space with either predicted naive ESM-2 protein fitness landscape or EVOLVEpro protein activity landscape. (I) A kernel density estimate plot of protein fitness as predicted by ESM-2 versus protein activity as predicted by EVOLVEpro. The correlation and linear regression line are shown in red and the R square of correlation is reported.
Fig. 4.
Fig. 4.. EVOLVEpro engineers enhanced large serine recombinases.
(A) Schematic of the evolution strategy for evolving the Bxb1 serine integrase from the Mycobacteriophage. (B) Engineering of the Bxb1 integrase over 8 rounds of EVOLVEpro. Data shows cumulative top 10 mutants from current and preceding rounds, as measured by fold improvement of plasmid integration over wild-type. (C) Performance of top Bxb1 mutants for plasmid recombination with low Bxb1 expression in Hela cell. A two-sided Student’s t-test was run between WT and each evolved Bxb1 integrase (***, p<0.001, ****, p<0.0001). Fold change over wild-type Bxb1 is shown for the best mutant. Error bars represent standard deviation with n=3 biological replicates. (D) Validation of epBxb1 with PASTE at four genomic sites across human and mice genomes. A two-sided Student’s t-test was run between WT and each evolved Bxb1 integrase (*, p<0.05, **, p<0.01). Fold change over wild-type Bxb1 integrase is shown for each genomic locus. Error bars represent standard deviation with n=3 biological replicates. (E) Mapping of the top mutations on the AlphaFold3 model of the Bxb1 monomer bound to DNA. Bxb1 forms a tetrameric synaptic complex during recombination between two DNA molecules. The active site is indicated by a red circle. (F) Heatmap showing most common Bxb1 mutations explored by EVOLVEpro over rounds of evolution. Any position explored more than once is shown on a cumulative basis across rounds. (G) Scatter plot comparing the predicted ESM-2 protein fitness score versus experimentally measured bxb1 integration efficiency (scaled) across evolution rounds. The correlation and linear regression line are shown in the plot. (H-I) Comparison of the Bxb1 latent space with either predicted ESM-2 protein fitness (masked marginal score) or EVOLVEpro protein activity fold improvement. (J) A kernel density estimate of protein fitness as predicted by ESM-2 versus protein activity as predicted by EVOLVEpro. The correlation and linear regression line are shown in red and the R square of correlation is reported.
Fig. 5.
Fig. 5.. Engineering RNA polymerases for high yield and low immunogenicity mRNA production.
(A) Schematic of the strategy for high throughput T7 RNA polymerases mutant testing and evolution policy setup for evolving a high fidelity T7 RNAP. (B) Engineering of T7 RNAP over six rounds of EVOLVEpro. Data shows the top 10 mutants from current and preceding rounds, as measured by fold improvement of transcription fidelity over wild-type. (C) Performance of T7 mutants from six EVOLVEpro rounds and previously engineered G47A/884G SOTA T7 RNAP in Cluc mRNA translation and immunogenicity in BJ Fibroblast cells. (D) Validation of epT7 for production of 6 mRNA sequences ranging from 513nt to 6496nt. Purified WT or mutant RNAP is used to produce these sequences, and they were transfected into BJ fibroblast cells for either protein translation readout or targeted IFNB1 gene expression analysis using qPCR 24 hours after transfection. A two-sided Student’s t-test was run between WT and each evolved T7 RNAP (**, p<0.01, ***, p<0.001, ****, p<0.0001). Error bars represent standard deviation with n=3 biological replicates. (E) dsRNA ELISA is used to analyze the amount of dsRNA during transcription of a 1662 nt Cypridina luciferase mRNA. 500 ng of post-transcription product is used as input for the dsRNA ELISA. A two-sided Student’s t-test was run between WT and each evolved T7 RNAP (****, p<0.0001). Error bars represent standard deviation with n=3 biological replicates. (F) Mapping of the top mutations on the T7 RNAP structure (PDB: 3E2E). The active site is indicated by a red circle. (G) Heatmap showing most common T7 RNAP mutations explored by EVOLVEpro over rounds of evolution. Any position explored more than once is shown on a cumulative basis across rounds. (H) Scatter plot comparing the predicted ESM-2 protein fitness score versus experimentally measured T7 RNAP transcription fidelity scaled score across evolution rounds. The correlation and linear regression line are shown in the plot. (I-J) Comparison of the T7 RNAP latent space with either predicted ESM-2 protein fitness (masked marginal score) or EVOLVEpro protein activity fold improvement. (K) A kernel density estimate of protein fitness as predicted by ESM-2 versus protein activity as predicted by EVOLVEpro. The correlation and linear regression line are shown in red and the R square of correlation is reported.
Fig. 6.
Fig. 6.. Application of epT7 for circular RNA production and in vivo bioluminescence.
(A) Schematic of circular RNA production. (B) Validation of epT7 produced circRNA on four different template sequences compared to both T7E643G and wild-type T7. Translation of each protein is measured in HEK293FT cells 48 hours after transfection. A two-sided Student’s t-test was run between WT and each evolved T7 RNAP ( ***, p<0.001, ****, p<0.0001). Error bars represent standard deviation with n=3 biological replicates. (C) Tapestation gel electrophoresis analysis of circular Fluc RNA produced by either epT7 or WT RNAP. epT7 shows reduced concatemer production. (D) Comparison of RNA products for Fluc circRNA produced by epT7 compared to wild-type T7 via gel electrophoresis using 2% E-gel EX at different steps in the production process: post-initial IVT and post-RNaseR processing. The panel on the right shows quantification of intermediate and nicked RNA ratio in the post IVT samples. Error bars represent standard deviation with n=3 biological replicates. (E) Comparison of purified GFP, nanoluc (Nluc), and Fluc circRNA yield by epT7 compared to wild-type T7 after the initial RNaseR clean-up. The panel on the left shows the raw mass percentage left after the cleanup. The panel on the right shows the purity of the circular RNA in the post clean-up reaction as determined by quantification using a TapeStation analysis. A two-sided Student’s t-test was run between WT and epT7 (**, p<0.01, ****, p<0.0001). (F) Comparison of dsRNA content for nanoluc circRNA produced by epT7 compared to wild-type T7 using either 2 hours of IVT or 12 hours of IVT. Input into the dsRNA ELISA assay involves 500 ng of post-RNAseR cleaned-up samples. A two-sided Student’s t-test was run between WT and evolved T7 RNAP (**, p<0.01). Error bars represent standard deviation with n=3 biological replicates. (G) Schematic of the in vivo mRNA assay for measuring mRNA expression in the liver via non-invasive luminescent imaging. (H) In vivo luminescent signal detected 24 hours post-injection in mice injected with mRNA produced by either epT7 or wild-type T7 or PBS controls. A two-sided Student’s t-test was run between WT, wild-type T7 RNAP, and epT7 (*, p<0.05). Error bars represent standard deviation with n=3 biological replicates. (I) Time-course of in vivo luminescent signal detected up to 96 hours post-injection of LNP-mRNA produced by either epT7 or wild-type T7, or PBS controls. A two-sided paired Student’s t-test was run between WT, wild-type T7 RNAP, and epT7 (*, p<0.05) for each time point. Error bars represent the standard error of mean with n=3 biological replicates. (J) A schematic showing the evolution of higher activity variants with EVOLVEpro. The mutagenesis landscape of proteins is often conceptualized as a complex terrain with numerous potential paths. Shown here is a gray road that conceptualizes the protein mutagenesis landscape where traversing upwards results in higher protein activity and traversing downwards reduces protein fitness. Traditional frameworks of evolutionary plausibility attempt to navigate this terrain based on natural selection, which is constrained by historical and environmental factors.

References

    1. Lin Z., Akin H., Rao R., Hie B., Zhu Z., Lu W., Smetanin N., Verkuil R., Kabeli O., Shmueli Y., Dos Santos Costa A., Fazel-Zarandi M., Sercu T., Candido S., Rives A., Evolutionary-scale prediction of atomic-level protein structure with a language model. Science 379, 1123–1130 (2023). - PubMed
    1. Heinzinger M., Weissenow K., Sanchez J. G., Henkel A., Mirdita M., Steinegger M., Rost B., Bilingual Language Model for Protein Sequence and Structure, bioRxiv (2024)p. 2023.07.23.550085. - PMC - PubMed
    1. Elnaggar A., Essam H., Salah-Eldin W., Moustafa W., Elkerdawy M., Rochereau C., Rost B., Ankh: Optimized Protein Language Model Unlocks General-Purpose Modelling, arXiv [cs.LG] (2023). http://arxiv.org/abs/2301.06568.
    1. Brandes N., Ofer D., Peleg Y., Rappoport N., Linial M., ProteinBERT: a universal deep-learning model of protein sequence and function. Bioinformatics 38, 2102–2110 (2022). - PMC - PubMed
    1. He Y., Zhou X., Chang C., Chen G., Liu W., Li G., Fan X., Sun M., Miao C., Huang Q., Ma Y., Yuan F., Chang X., Protein language models-assisted optimization of a uracil-N-glycosylase variant enables programmable T-to-G and T-to-C base editing. Mol. Cell 84, 1257–1270.e6 (2024). - PubMed

Publication types

LinkOut - more resources