[Preprint]. 2024 Sep 6:2024.07.16.603732.
doi: 10.1101/2024.07.16.603732.

Chlamydia muridarum Causes Persistent Subclinical Infection and Elicits Innate and Adaptive Immune Responses in C57BL/6J, BALB/cJ and J:ARC(S) Mice Following Exposure to Shedding Mice

Affiliations

Chlamydia muridarum Causes Persistent Subclinical Infection and Elicits Innate and Adaptive Immune Responses in C57BL/6J, BALB/cJ and J:ARC(S) Mice Following Exposure to Shedding Mice

Noah Mishkin et al. bioRxiv. .

Update in

Abstract

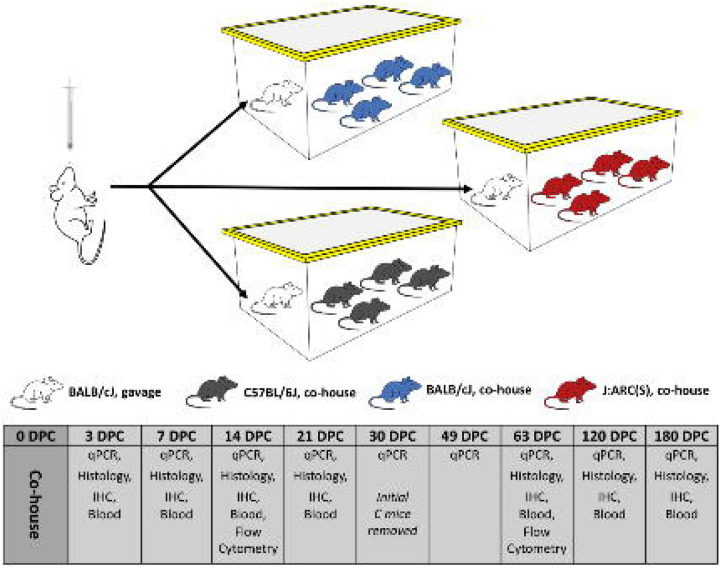
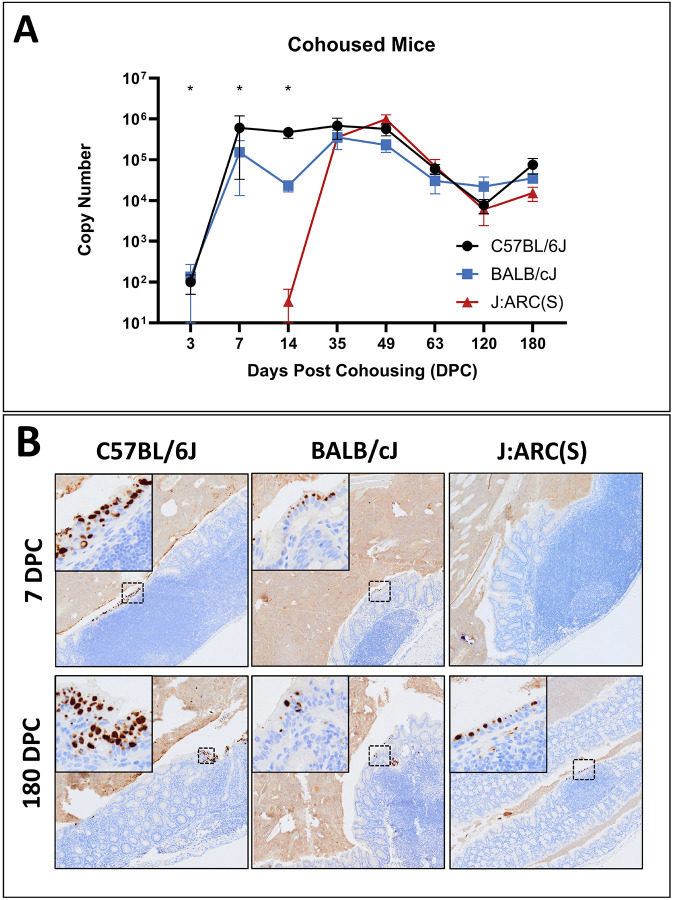
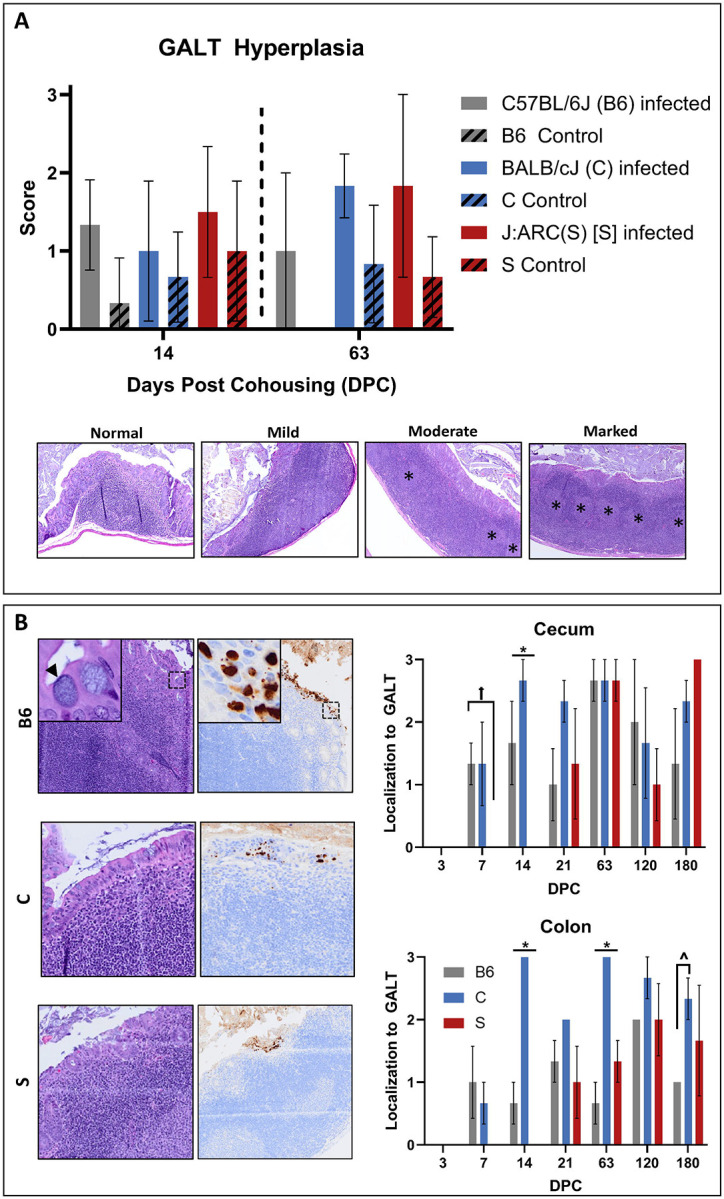
Chlamydia muridarum (Cm) has reemerged as a moderately prevalent infectious agent in research mouse colonies. Despite its' experimental use, few studies evaluate Cm's effects on immunocompetent mice following its natural route of infection. A Cm field isolate was administered (orogastric gavage) to 8-week-old female BALB/cJ (C) mice. After confirming shedding (through 95d), these mice were cohoused with naïve C57BL/6J (B6), C, and Swiss (J:ARC[S]) mice (n=28/strain) for 30 days. Cohoused mice (n=3-6 exposed and 1-6 control/strain) were evaluated 7, 14, 21, 63, 120, and 180 days post-cohousing (DPC) via hemograms, serum biochemistry analysis, fecal qPCR, histopathology, and Cm MOMP immunohistochemistry. Immunophenotyping was performed on spleen (B6, C, S; n=6/strain) and intestines (B6; n=6) at 14 and 63 DPC. Serum cytokine concentrations were measured (B6; n=6 exposed and 2 control) at 14 and 63 DPC. All B6 mice were shedding Cm by 3 through 180 DPI. One of 3 C and 1 of 6 S mice began shedding Cm at 3 and 14 DPC, respectively, with the remaining shedding thereafter. Clinical pathology was nonremarkable. Minimal-to-moderate enterotyphlocolitis and gastrointestinal associated lymphoid tissue (GALT) hyperplasia was observed in 15 and 47 of 76 Cm-infected mice, respectively. Cm antigen was frequently detected in GALT-associated surface intestinal epithelial cells. Splenic immunophenotyping revealed increased monocytes and shifts in T cell population subsets in all strains/timepoints. Gastrointestinal immunophenotyping (B6) revealed sustained increases in total inflammatory cells and elevated cytokine production in innate lymphoid cells and effector T cells (large intestine). Elevated concentrations of pro-inflammatory cytokines were detected in the serum (B6). Results demonstrate that while clinical disease was not appreciated, 3 commonly utilized strains of mice are susceptible to chronic enteric Cm infection which may alter various immune responses. Considering the widespread use of mice to model GI disease, institutions should consider excluding Cm from their colonies.


Conflict of interest statement

Conflicts of Interest Kenneth Henderson, Cheryl Woods, and Panagiota Momtsios are employees of Charles River Laboratories, a company that produces and distributes research models and provides diagnostic services. The other authors have no competing interest to declare.

Figures

Figure 1.
Figure 1.. Investigative plan.
BALB/cJ (C) mice inoculated with and shedding Cm were cohoused with naïve C, C57BL/6J (B6), or J:ARC(S) [S] mice (1 infected C mouse with 4 naïve C, B6, or S mice per cage) for 30 days. Mice were monitored for 180 days. Three experimental and 1 control mouse per strain/stock were selected for qPCR, hemogram/serum biochemistry analysis, complete necropsy and IHC at 3, 7, 14, 21, 63, 120, and 180 DPC. Additional mice were sacrificed at 14 and 63 DPC for splenic and gastrointestinal tract (B6 only) immunophenotyping.
Figure 2.
Figure 2.. Fecal shedding and intestinal colonization with Cm.
(A) Fecal qPCR data (mean Cm copy number +/− SEM) by timepoint and strain/stock (n=3–6 mice/timepoint). *= significant difference between C57BL/6J (B6) and BALB/cJ (C), and the J:ARC(S) [S] strain/stock (Kruskal-Wallis test, p≤0.05). (B) Immunohistochemical staining for Cm MOMP. Cm antigen immunolabeling in surface epithelial cells throughout the colon (intracellular brown staining) of B6, C and S mice at 7 and 180 DPC. Cm inclusions are noted in the cytoplasm of enterocytes (insets). Immunolabeling is detected in B6 and C mice at 7 DPC and all strains/stocks at 180 DPC. Staining of luminal contents reflects non-specific staining of extracellular debris Immunohistochemistry for MOMP antigen, 2x (insets 10x).
Figure 3.
Figure 3.. A subset of Cm-infected mice exhibited mild colitis at 180 DPC.
(top row) Representative histology of the colon from uninfected (control) C57BL/6J (B6), BALB/cJ (C), and J:ARC(S) [S] mice demonstrating normal intestinal mucosa and submucosa. H&E, 60x. (bottom row) A subset of Cm-infected B6 and S mice developed mild multifocal colitis at 180 DPC. The lamina propria and/or submucosa was infiltrated by lymphocytes, plasma cells, (yellow arrowheads), histiocytes, and less frequently neutrophils. No colitis was observed in Cm-infected C mice. Inset depicts Cm MOMP immunolabeling (dashed box) in the cytoplasm of colonic enterocytes from infected C mice. H&E, 60x (inset: immunohistochemistry for Cm MOMP antigen).
Figure 4.
Figure 4.. Cm large intestinal colonization is associated with GALT.
(A) GALT hyperplasia scores (mean +/− SEM) at 14 and 63 DPC in C57BL/6J (B6, n=3/timepoint), BALB/cJ (C, n=6/timepoint), and J:ARC(S) [S, n=6/timepoint] mice. No significant differences in GALT hyperplasia were appreciated due to a small sample size, however infected mice had higher scores at both 14 and 63 DPC. Representative examples of normal (0), mild (1), moderate (2), and marked (3) GALT hyperplasia in the large intestine from S mice at 63 DPC are presented. * = prominent germinal centers. H & E, 5x. (B) Association between Cm-infected epithelial cells and GALT in B6, C, and S mice (n=3–6 mice/timepoint). Cm infection of epithelial cells overlying GALT provided in images on left. Arrowhead=IB; Cm MOMP antigen (brown staining) present in epithelium overlying GALT in photomicrographs. IHC for MOMP. 2x (insets 20x). GALT association scores (mean +/− SEM) in the cecum and colon of B6, C, and S mice at various times post-cohousing in the histogram on the right. * = significant differences (p=<0.05) between each strain/stock; ^= significant differences (p=<0.05) between B6 and C mice; = significant differences (p=<0.05) between B6 and S mice.
Figure 5:
Figure 5:. T cell subsets in small and large intestinal GALT.
Representative immunohistochemistry for CD4, CD8 and Foxp3 cells in the GALT of C57BL/6J mice at 14 DPC. Infected mice had T cell populations comprised of primarily CD4 positive cells (left panels, brown cytoplasmic/membranous immunolabeling of round cells) with less frequently observed CD8 positive cells (middle panels, brown cytoplasmic/membranous immunolabeling of round cells). Both CD4 and CD8 positive cells were often found clustering in interfollicular regions between germinal centers and scattered in the mantle zones, perifollicular regions, and associated lamina propria. The small intestine from the uninfected control mice had similar immunolabeling of CD4 and CD8 positive lymphocytes as found in infected mice, but the CD4 positive cells were less obvious in controls. The lymphocyte populations of CD4 and CD8 cells in the large intestine were increased and more homogenous in uninfected controls. Both infected and uninfected mice presented with infrequent T regulatory cells (assessed via Foxp3; right panels, brown nuclear immunolabeling). Immunohistochemistry for CD4, CD8, and Foxp3, 5x (insets 20x).
Figure 6:
Figure 6:. ISH staining for Cm in the gastrointestinal tract, lungs and uterus.
(A) Cm nucleic acid (punctate dot red staining, arrowheads) is detected in apical epithelial cells of the colon in a Cm-infected C57BL/6J mouse, 63 DPC. ISH for Cm, 10x. (B) Lungs from an Cm-infected J:ARC(S) [S] mouse, 63 DPC demonstrating no Cm nucleic acid hybridization. ISH for Cm, subgross. (C) Cm nucleic acid is not detected in the uterus from a Cm-infected S mouse at 14 DPC. ISH for Cm, subgross.
Figure 7.
Figure 7.. Immunophenotyping of splenic immune cells during early and late stages of Cm infection in C57BL/6J (B6) mice.
(A) Gating strategy defining the immune subpopulations of splenic cells after excluding debris, doublets, and dead cells. Splenic immune cells were first identified as CD45+ cells. B cells were then quantified as CD3/B220+. T cells were identified as CD3+. CD8 and CD4 T cells were identified by expression of their respective marker, while the subpopulation of Treg was identified as CD4+/CD25+/CD127. CD4+ and CD8+ T cell activation was identified as CD69+. Neutrophils and monocytes were quantified as CD11b+, and further distinguished as Ly6G+ and Ly6G–Ly6C+, respectively. Data displayed are from B6 mice at 14 DPC. (B) Infected B6 mice demonstrated increased frequencies of myeloid and lymphoid cell population subtypes when compared to uninfected controls, including monocytes (63 DPC), effector CD4+ T cells (14 and 63 DPC), effector CD8+ T cells (63 DPC) and effector memory CD8+ T cells (14 DPC). Other population increases did not reach statistical significance. Additionally, infected B6 mice had fewer B cells (63 DPC), naïve CD4+ cells (14 DPC), and overall CD8+ T cells (14 FPC). Data represent the frequencies of specific cell populations as compared with the parent population and are displayed as the proportions of average values in infected as compared to control mice (n=6 mice/group). Dotted line (1.0) indicates no difference in frequency of detection between control and infected mice. Values above this line represent an increased frequency of detection in infected mice and values below this line represent a decreased frequency of detection in infected mice. macro = macrophage; mono = monocyte; neut = neutrophil; EM = effector memory cell; TIC = total immune cells. *=p≤0.05.
Figure 8.
Figure 8.. Immunophenotyping of splenic immune cells during early and late stages of Cm infection in BALB/cJ (C) and J:ARC(S) [S] mice.
Data (A and B) represent the frequencies of specific cell populations as compared with the parent population and are displayed as proportions of average values of infected as compared to control mice (n=6 mice/group). Dotted line (1.0) indicates no difference in frequency of detection between control and infected mice. Values above this line represent an increased frequency of detection in infected mice and values below this line represent a decreased frequency of detection in infected mice. (A) Infected C mice demonstrated increased frequencies of myeloid and lymphoid cell population subtypes when compared to uninfected controls, including monocytes (63 DPC) and central memory CD8+ T cells (63 DPC). Additionally, Cm-infected mice demonstrated fewer macrophages and CD4+ T cells when compared to uninfected controls at 14 DPC. (B) Infected S mice demonstrated increased frequencies of myeloid and lymphoid cell population subtypes when compared to uninfected controls, including monocytes (63 DPC), effector CD4+ T cells (63 DPC), effector memory CD8+ T cells (63 DPC), and naïve CD8+ T cells (14 DPC). Additionally, infected mice demonstrated fewer naïve CD4+ T cells and effector CD8+ T cells when compared to uninfected controls at 14 DPC. macro = macrophage; mono = monocyte; neut = neutrophil; EM = effector memory cell; TIC = total immune cells. * =p≤0.05.
Figure 9.
Figure 9.. Immunophenotyping of large intestinal immune cells during early and late stages of Cm infection in C57BL/6J (B6) mice.
(A) Gating strategy defining the immune subpopulations of the large intestinal cells after excluding debris, doublets, and dead cells. Immune cells were first identified as CD45+ cells. T cells were then identified as Lin1+, and ILCs as Lin1. CD4 T cells were identified by expression of CD4, and further classified as effector (Tbet) or regulatory (Foxp3) CD4+ T cells. ILC3s were identified as CD90 and CD127+. Data displayed are from B6 mice at 14 DPC. (B) Representative flow cytometric analyses from CD4 T cell and ILC3 subsets. There were significantly more total immune cells (CD45+) in the large intestine of infected mice compared to uninfected controls at both 14 and 63 DPC. Additionally, the cells isolated from the large intestine of infected B6 mice demonstrated increased frequencies of several CD4+ T cell and ILC subtypes associated with Th1 and Th17 cell immune responses when compared to uninfected controls. These mice had more frequent Teff CD4+ cells (14 and 63 DPC), and fewer Treg cells (14 DPC). These Teff cells more frequently expressed both Tbet and RORγ (63 DPC). Additionally, ILCs and the ILC3 subtype more frequently expressed T-bet (63 DPC), and the ILC3 subtype also more frequently expressed CCR6 (63 DPC). Finally, the large intestine immune cells more frequently expressed several cytokines (with ILC3 having more frequent GMCSF at 63 DPC, IL-17A at 14 DPC, and IL-22 at both 14 and 63 DPC, and CD4+ T cells have more frequent IFNγ, IL17A, and IL22 at both 14 and 63 DPC). Data represent the frequencies of specific cell populations as compared with the parent population and are displayed here as proportions of average values of infected as compared to control mice (n=6 mice/group). Dotted line (1.0) indicates no difference in frequency of detection between control and infected mice. Values above this line represent an increased frequency of detection in infected mice and values below this line represent a decreased frequency of detection in infected mice. macro = macrophage; mono = monocyte; neut = neutrophil; EM = effector memory cell; TIC = total immune cells. *=p≤0.05.
Figure 10.
Figure 10.. Cytokine expression in Cm-infected C57BL/6J mice at 14 and 63 DPC.
Cm-infected mice express significantly more IL-6 than uninfected counterparts at 14 DPC, while at 63 DPC, Cm-infected mice express greater levels of both IL-4 (associated with Th2 responses) and IL-12p70 (associated with Th1 responses) as compared to uninfected controls. IL-12p70 is markedly elevated. Additionally, Cm-infected mice exhibited an increase in IL-4, IL-10, and IL-12p70 from 14 DPC to 63 DPC. Data represents a single experiment with 6 mice/group. Bars represent the SEM. * = p≤0.05.

References

    1. American Association for Laboratory Animal Services. [Internet]. 2021. Alleviating pain and distress in laboratory animals. [Cited 11 July 2024]. Available at https://www.aalas.org/about-aalas/position-papers/alleviating-pain-and-d....
    1. American Association for Laboratory Animal Sciences. [Internet]. 2021. Humane care and use of laboratory animals. [Cited 11 July 2024]. Available at https://www.aalas.org/about-aalas/positionpapers/humane-care-and-use.
    1. Barone M, Chain F, Sokol H, Brigidi P, Bermúdez-Humarán LG, Langella P, Martín R. 2018. A versatile new model of chemically induced chronic colitis using an outbred murine strain. Front Microbiol 9: 565. 10.3389/fmicb.2018.00565. - DOI - PMC - PubMed
    1. Brunham RC, Rey-Ladino J. 2005. Immunology of Chlamydia infection: implications for a Chlamydia trachomatis vaccine. Nat Rev Immunol 5:149–161. 10.1038/nri1551. - DOI - PubMed
    1. Carrasco SE, Hu S, Imai DM, Kumar R, Sandusky GE, Frank Yang X, Derbigny WA. 2018. Toll-like receptor 3 (TLR3) promotes the resolution of Chlamydia muridarum genital tract infection in congenic C57BL/6N mice. PLoS One 13: e0195165. 10.1371/journal.pone.0195165. - DOI - PMC - PubMed

Publication types

LinkOut - more resources