. 2024 Jul 23:19:7473-7492.
doi: 10.2147/IJN.S464498. eCollection 2024.

Magnetic Stimulation of Gigantocellular Reticular Nucleus with Iron Oxide Nanoparticles Combined Treadmill Training Enhanced Locomotor Recovery by Reorganizing Cortico-Reticulo-Spinal Circuit

Affiliations

Magnetic Stimulation of Gigantocellular Reticular Nucleus with Iron Oxide Nanoparticles Combined Treadmill Training Enhanced Locomotor Recovery by Reorganizing Cortico-Reticulo-Spinal Circuit

Juan Li et al. Int J Nanomedicine. .

Abstract

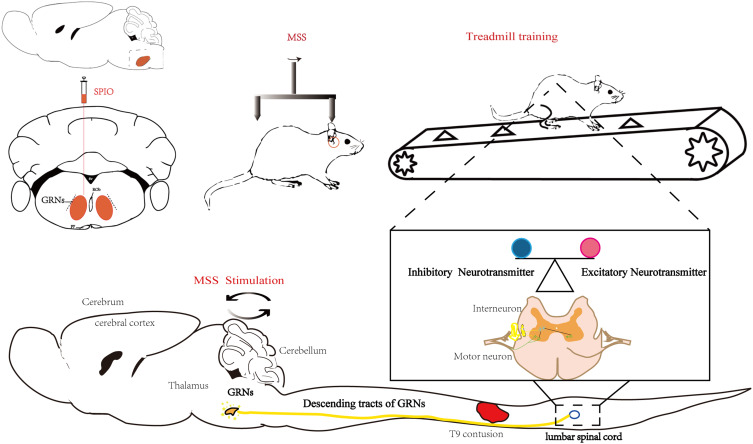
Background: Gigantocellular reticular nucleus (GRNs) executes a vital role in locomotor recovery after spinal cord injury. However, due to its unique anatomical location deep within the brainstem, intervening in GRNs for spinal cord injury research is challenging. To address this problem, this study adopted an extracorporeal magnetic stimulation system to observe the effects of selective magnetic stimulation of GRNs with iron oxide nanoparticles combined treadmill training on locomotor recovery after spinal cord injury, and explored the possible mechanisms.

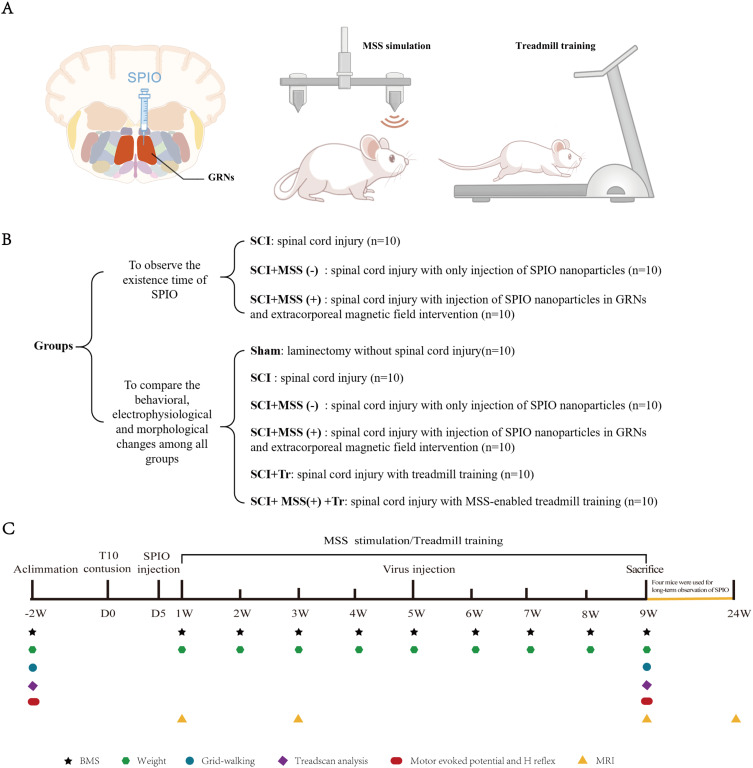
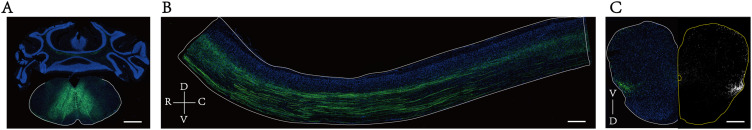
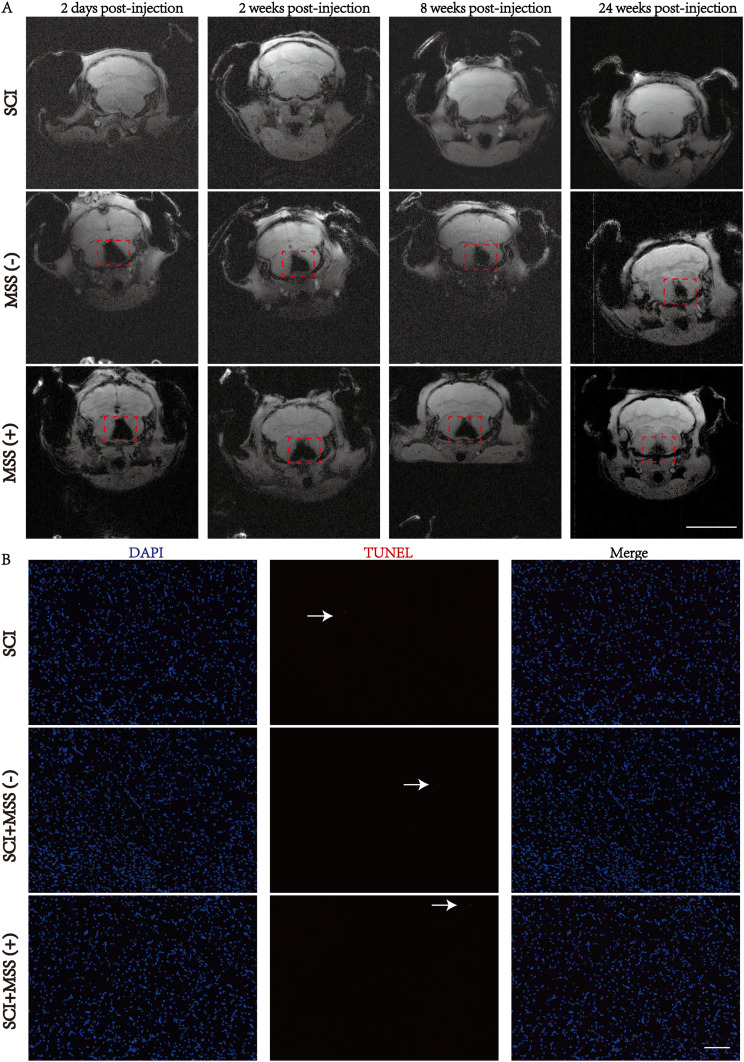
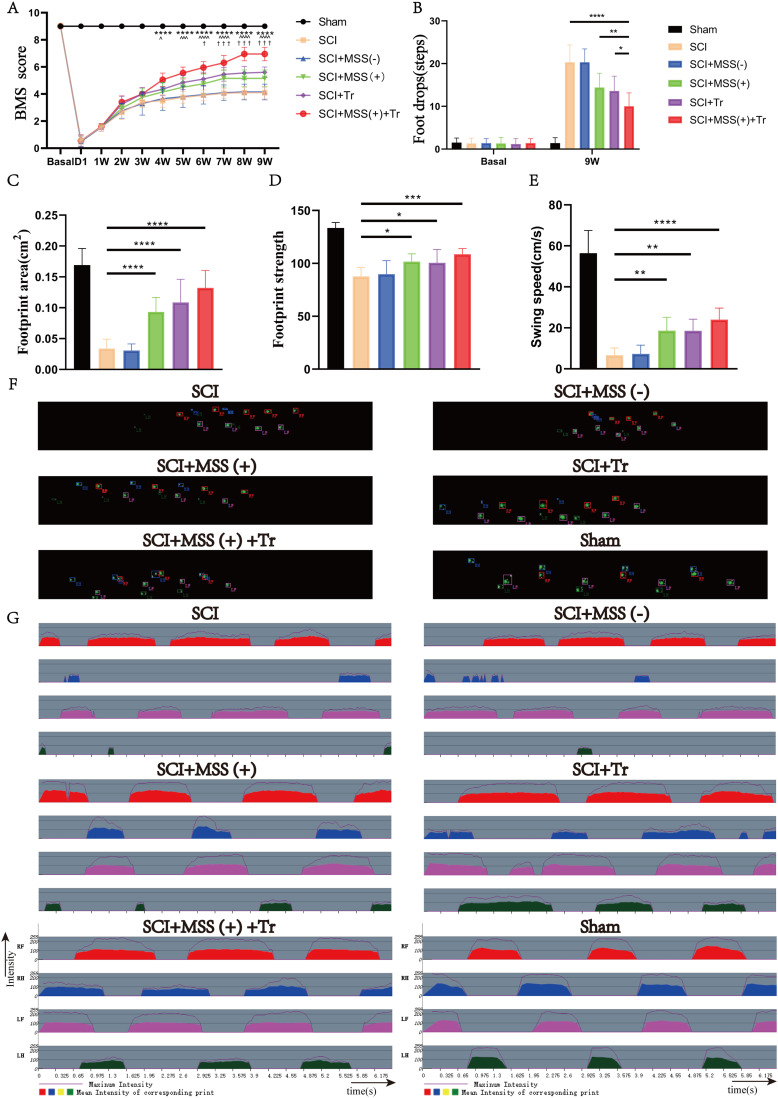
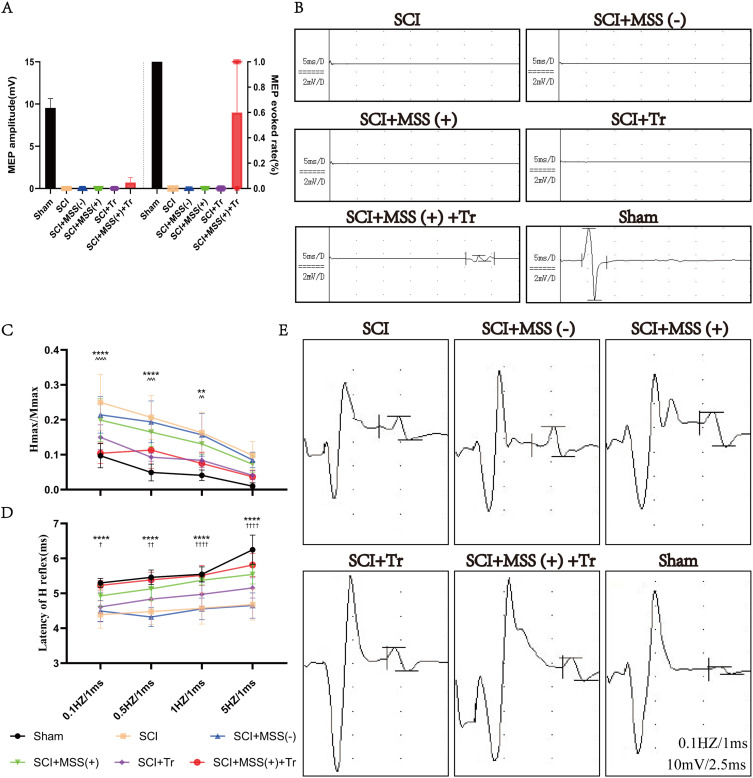
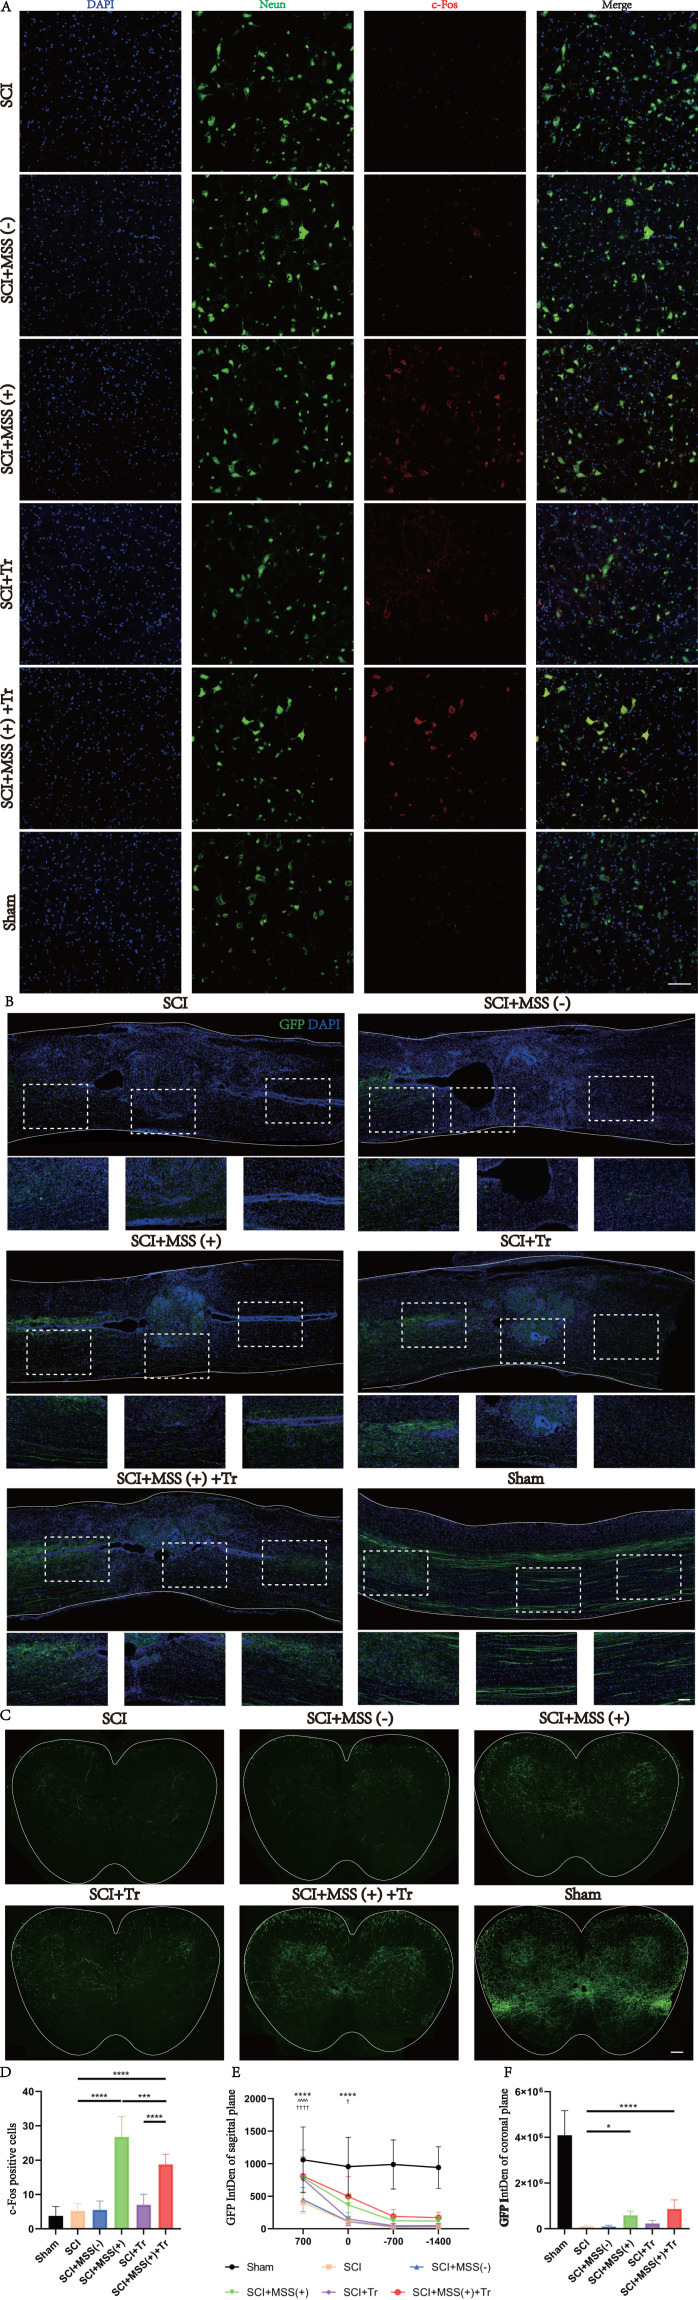
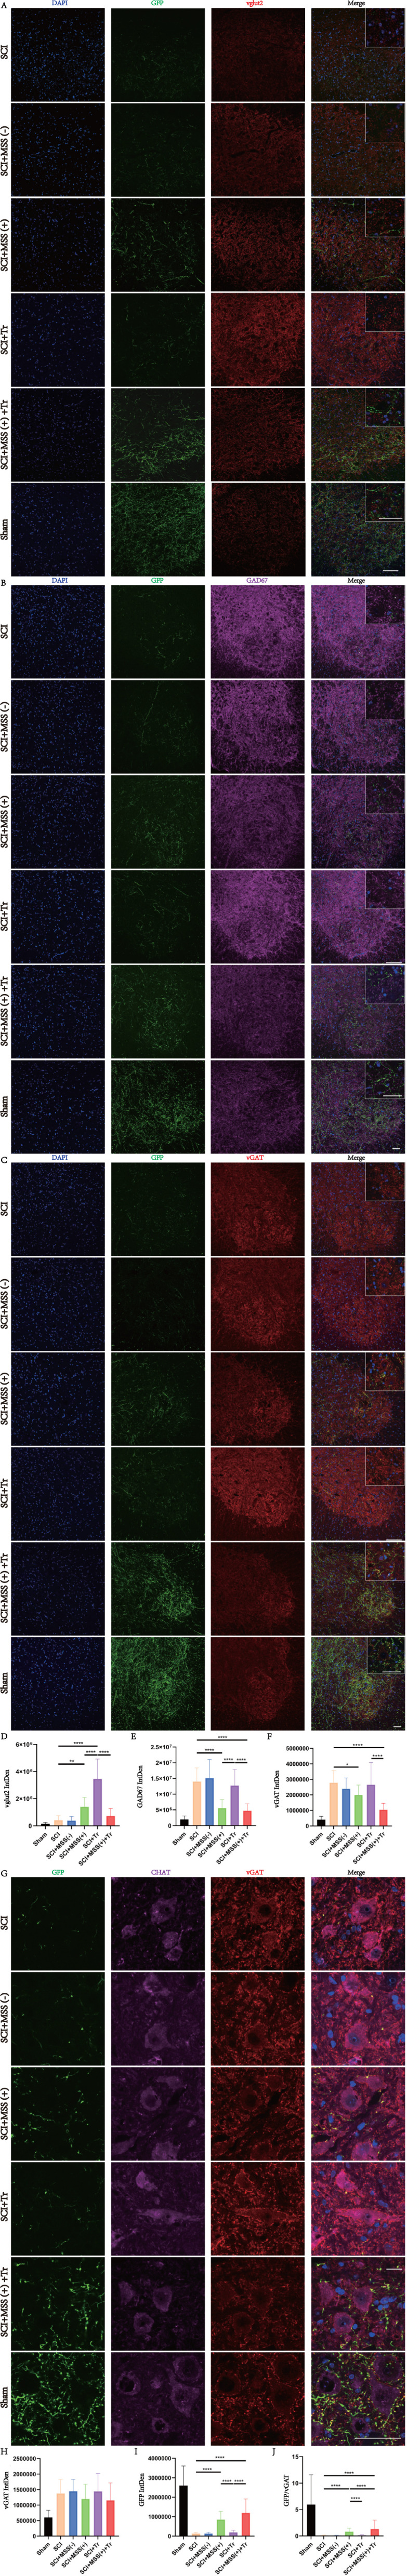
Methods: Superparamagnetic iron oxide (SPIO) nanoparticles were stereotactically injected into bilateral GRNs of mice with moderate T10 spinal cord contusion. Eight-week selective magnetic stimulation produced by extracorporeal magnetic stimulation system (MSS) combined with treadmill training was adopted for the animals from one week after surgery. Locomotor function of mice was evaluated by the Basso Mouse Scale, Grid-walking test and Treadscan analysis. Brain MRI, anterograde virus tracer and immunofluorescence staining were applied to observe the tissue compatibility of SPIO in GRNs, trace GRNs' projections and evaluate neurotransmitters' expression in spinal cord respectively. Motor-evoked potentials and H reflex were collected for assessing the integrity of cortical spinal tract and the excitation of motor neurons in anterior horn.

Results: (1) SPIO persisted in GRNs for a minimum of 24 weeks without inducing apoptosis of GRN cells, and degraded slowly over time. (2) MSS-enabled treadmill training dramatically improved locomotor performances of injured mice, and promoted cortico-reticulo-spinal circuit reorganization. (3) MSS-enabled treadmill training took superimposed roles through both activating GRNs to drive more projections of GRNs across lesion site and rebalancing neurotransmitters' expression in anterior horn of lumbar spinal cord.

Conclusion: These results indicate that selective MSS intervention of GRNs potentially serves as an innovative strategy to promote more spared fibers of GRNs across lesion site and rebalance neurotransmitters' expression after spinal cord injury, paving the way for the structural remodeling of neural systems collaborating with exercise training, thus ultimately contributing to the reconstruction of cortico-reticulo-spinal circuit.

Keywords: gigantocellular reticular nucleus; locomotion; magnetic stimulation; spinal cord injury; superparamagnetic iron oxide nanoparticles; treadmill training.


Conflict of interest statement

All authors declare that the research was conducted in the absence of any commercial or financial relationships that could be construed as a potential conflict of interest.

Figures

None
Graphical abstract
Figure 1
Figure 1
Experimental Design. (A) Schematic diagram of the experimental procedure. After injecting SPIO into the GRNs region, mice in SCI+MSS (+) group would be subjected to extracorporeal magnetic field intervention, and mice in SCI+MSS (+) +Tr group would undergo treadmill training immediately after receiving external magnetic field intervention. (B) Experimental groups. (C) A timeline of the entire experiment, including the time points of different interventions and related evaluations.
Figure 2
Figure 2
Injection site of GRNs in the brainstem and its projection patterns in the spinal cord. (A) rAAV anterograde tracing virus (rAAV-hSyn-EGFP-WPRE-hGH pA) was bilaterally injected at GRNs in the brainstem according to anatomical localization, resulting in neuronal cell bodies expressing green fluorescence at the injection site. (B) Projections of GRNs tracing along the sagittal plane of the thoracolumbar spinal cord, as shown by green fluorescence. (C) Projections of GRNs distributed in the coronal plane of the lumbar spinal cord, represented by the green fluorescence image on the left side and the grayscale image on the right side. Bar=1000 μm.
Figure 3
Figure 3
Stability and safety of SPIO nanoparticles in GRNs. (A) In vivo coronal MRI images of SPIO nanoparticles in GRNs. After injecting SPIO into the GRNs region, mice in SCI, SCI+MSS (-) and SCI+MSS (+) groups were evaluated by MRI in vivo at 2 days, 2 weeks, 8 weeks and 24 weeks post-injection. The red dashed box indicates the region of SPIO injection. n=4; Bar=5mm. (B) TUNEL staining of GRNs region. Representative images of TUNEL-positive nuclei (red color) (x10 magnification) were shown at SCI, SCI+MSS (-) and SCI+MSS (+) groups after 8 weeks of SPIO injection. The white arrows indicate TUNEL-positive cells. Bar=100 μm; n=6.
Figure 4
Figure 4
Locomotor recovery was enhanced prominently by MSS-enabled treadmill training. (A) BMS scores were analyzed (n = 10 mice per group at each time point). Represented a comparison between the SCI group and SCI+MSS (+) group (P < 0.05; †††P < 0.001); ^represented a comparison between the SCI group and SCI+Tr group (^P < 0.05; ^^^P < 0.001); *represented a comparison between the SCI group and SCI+ MSS (+) +Tr group (****P < 0.0001). Two-way repeated-measures ANOVA with Fisher’s LSD. (B) Grid walking test was performed in the same six groups (n = 10 mice per group at each time point) by two-way ANOVA with Tukey’s test. P < 0.05; **P < 0.01, ****P < 0.0001. (CE) The footprint area, footprint strength and swing speed of the hindlimbs respectively were evaluated in the same six groups (n = 10 mice per group at each time point) by Dunn’s Test for multiple comparisons. *P < 0.05; **P < 0.01, ***P < 0.001, ****P < 0.0001. (F) Representative images of footprint area were shown in each group exported by Treadscan device. (G) Representative images of footprint strength were shown in each group exported by Treadscan device. Data are presented as means ± SD.
Figure 5
Figure 5
Motor neuron excitability was modulated by MSS and cortico-reticulo-spinal circuit was reorganized by MSS-enabled treadmill training. (A) Cortico–reticulo–spinal circuit reorganization was reflected by evocation of MEP only in mice of SCI+MSS (+) +Tr group after SCI could be successfully evoked. The amplitude of MEP in Sham group was 9.55 ± 1.0928 mV, and in SCI+MSS (+) +Tr group, it was 0.70959 ± 0.57379 mV. It was shown in left side. The evoked rate of MEP, shown at right side, was 100% in Sham group (10 out of 10), and 60% in SCI+MSS (+) +Tr group (6 out of 10). (B) Representative images of MEP in each group. Except for the Sham group and the SCI+MSS (+) +Tr group, none of the other four groups were able to induce MEP after SCI. Although the MEP amplitude and latency were lower and longer, respectively, in the SCI+MSS (+) +Tr group compared to the Sham group, this represents a reorganization of the cortico-reticulo-spinal circuit. (C and D) Motor neuron excitability was reflected by H reflex. Statistical analysis of the Hmax/Mmax and latency of H reflex in different groups (n = 10) at 0.1 Hz, 0.5 Hz, 1 Hz and 5 Hz was shown in (C and D), respectively. Represented a comparison between the SCI group and SCI+MSS (+) group (P < 0.05; ††P < 0.01; ††††P < 0.0001); ^represented a comparison between the SCI group and SCI+Tr group (^^P < 0.01; ^^^P < 0.001; ^^^^P < 0.0001); *represented a comparison between the SCI group and SCI+ MSS (+) +Tr group (**P < 0.01; ****P < 0.0001). Two-way repeated-measures ANOVA with Fisher’s LSD. (E) Representative electromyogram signal of eliciting H reflex in different groups at 0.1 Hz.
Figure 6
Figure 6
MSS intervention fired more GRNs’ projections across the lesion site. (A) Representative images of c-Fos positive cells at GRNs region in each group, c-Fos (red) counterstaining with Neuron marker (green), with the size (Unit Converted) 636.396 μm *636.396 μm. Statistical analysis of the numbers of c-Fos positive cells was performed in the same six groups (n = 6 mice per group) by Dunn’s Test for multiple comparisons, shown at (D) (***P < 0.001; ****P < 0.0001). Bar=100 μm. (B) Representative images of GRNs’ projections (green) across the lesion site in sagittal sections, as well as higher magnification views at the lesion center, both above and below the center in each group (corresponding to the white dashed box). Quantification of GRNs’ projection at four sites in sagittal sections (taking the images with the lesion center as the reference site, one above the center, another two below the center, 700 μm, 0 μm, −700 μm, and −1400 μm respectively) was shown at (E). Represented a comparison between the SCI group and SCI+MSS (+) group (P < 0.05; ††††P < 0.0001); ^represented a comparison between the SCI group and SCI+Tr group (^^^^P < 0.0001); *represented a comparison between the SCI group and SCI+ MSS (+) +Tr group (****P < 0.0001). Two-way repeated-measures ANOVA with Fisher’s LSD. Scale bar: 100 μm, n=6. (C) Representative images of GRNs’ projections (green) at the lumbar spinal cord according to coronal sections and statistical analysis of GRNs’ projections at coronal sections was performed by Dunn’s Test for multiple comparisons, shown at (F). Scale bar: 100 μm, n=6.
Figure 7
Figure 7
MSS intervention rebalancing neurotransmitters’ expression of spinal anterior horn. (AC) Representative images of GRNs’ projections (GFP) co-stained with vglut2 (red), GAD67 (purple) and vGAT (red) at anterior horn in the lumbar spinal cord, respectively. Higher magnifications depicted in the white box. (DF) Statistical analysis of vglut2, GAD67and vGAT expression levels was performed by Dunn’s Test for multiple comparisons, respectively (*P < 0.05; **P < 0.01; ****P < 0.0001). Bar=50 μm. n=6. (D) Representative images of GRNs’ projection (GFP) co-stained for CHAT (purple), vGAT (red) of anterior horn in lumbar spinal cord. (HJ) Statistical analysis of vGAT, GFP and GFP/vGAT expression levels was performed by Dunn’s Test for multiple comparisons, respectively (****P < 0.0001). Bar=50 μm. n=6.

Similar articles

References

    1. Kakulas BA. A review of the neuropathology of human spinal cord injury with emphasis on special features. J Spinal Cord Med. 1999;22(2):119–124. doi:10.1080/10790268.1999.11719557 - DOI - PubMed
    1. Petersen JA, Wilm BJ, von Meyenburg J, et al. Chronic cervical spinal cord injury: DTI correlates with clinical and electrophysiological measures. J Neurotrauma. 2012;29(8):1556–1566. doi:10.1089/neu.2011.2027 - DOI - PubMed
    1. Barthelemy D, Willerslev-Olsen M, Lundell H, Biering-Sorensen F, Nielsen JB. Assessment of transmission in specific descending pathways in relation to gait and balance following spinal cord injury. Prog Brain Res. 2015;218:79–101. - PubMed
    1. Sangari S, Lundell H, Kirshblum S, Perez MA. Residual descending motor pathways influence spasticity after spinal cord injury. Ann Neurol. 2019;86(1):28–41. doi:10.1002/ana.25505 - DOI - PMC - PubMed
    1. Asboth L, Friedli L, Beauparlant J, et al. Cortico-reticulo-spinal circuit reorganization enables functional recovery after severe spinal cord contusion. Nat Neurosci. 2018;21(4):576–588. doi:10.1038/s41593-018-0093-5 - DOI - PubMed