

Perfusion Mapping of Flaps Using Indocyanine Green Fluorescence Angiography and Laser Speckle Contrast Imaging
- PMID: 39071769
- PMCID: PMC11281778
- DOI: 10.1097/GOX.0000000000005964
Perfusion Mapping of Flaps Using Indocyanine Green Fluorescence Angiography and Laser Speckle Contrast Imaging
Abstract
Background: Indocyanine green fluorescence angiography (ICG-FA) is often used for assessing tissue circulation in reconstructive surgery. Indocyanine green (ICG) is injected intravenously and visualized in the tissue with an infrared camera. The information is used to plan the surgery, for example, in free flap breast reconstructions. Laser speckle contrast imaging (LSCI) is another method that uses laser to assess tissue perfusion in the skin. Unlike ICG-FA, LSCI is noninvasive and may therefore have an advantaged compared with ICG-FA. The aim of this study was to evaluate the correlation between information obtained from these two techniques.
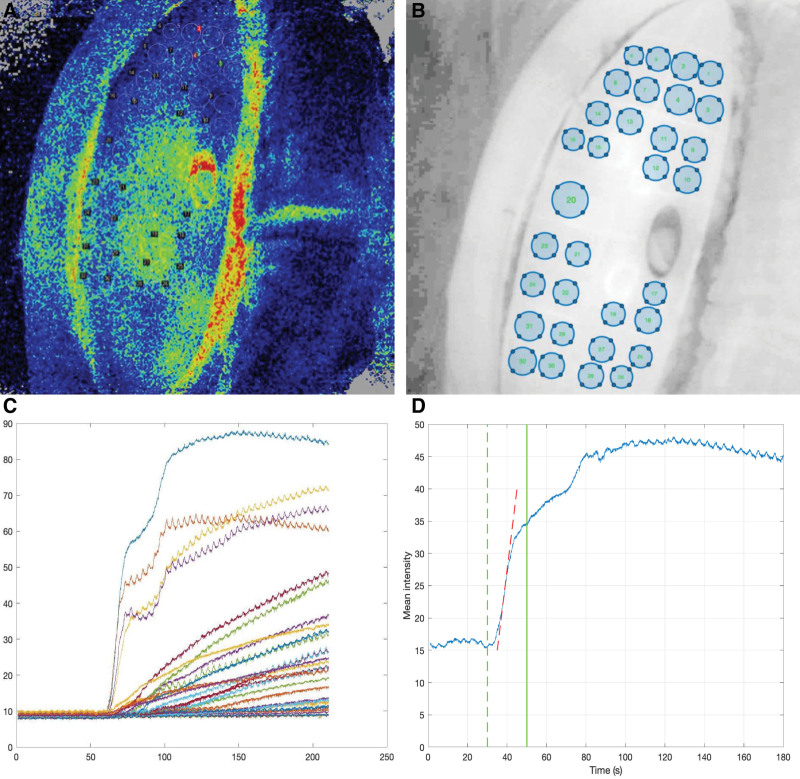
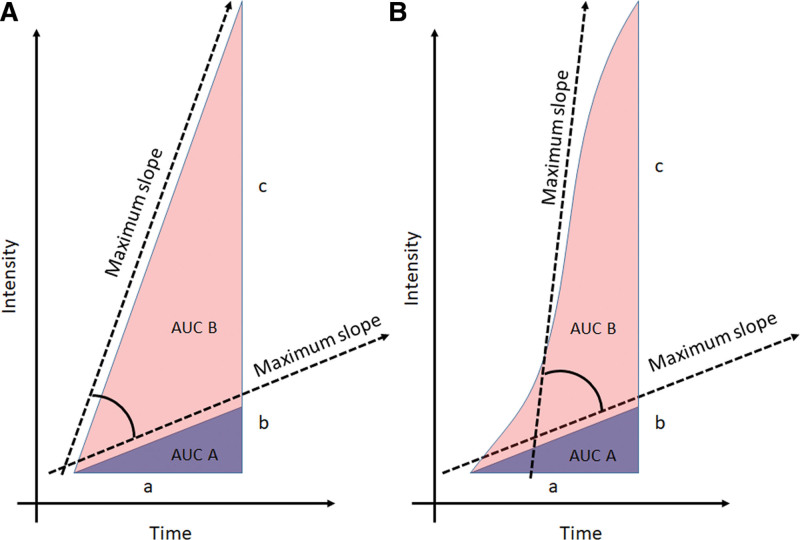
Methods: Five deep inferior epigastric perforator patients were included. The flaps were assessed with LSCI and ICG-FA. For LSCI, the perfusion was calculated in 32 regions of interest. For ICG-FA, the maximum slope and area under curve (AUC) were calculated based on average pixel intensity data.
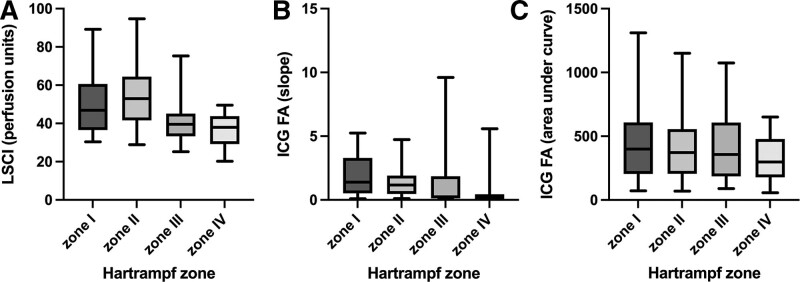
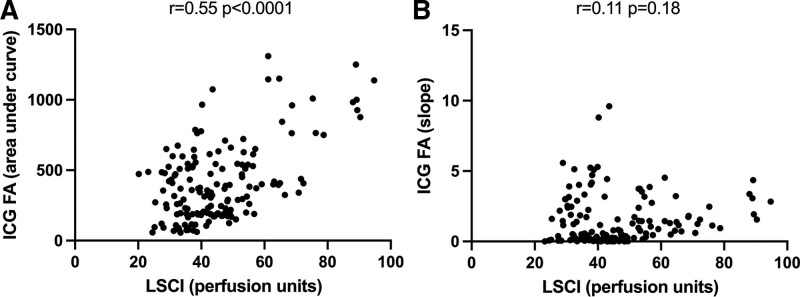
Results: Large variations in maximum slope values could be seen between flaps, whereas AUC had lower variability within the same flap and between flaps. Pearson rank correlation comparing average perfusion (LSCI) and AUC (ICG-FA) showed a correlation between the values (r = 0.55, P < 0.0001). No significant correlation was observed between perfusion and maximum slope (r = 0.11, P = 0.18).
Conclusions: There is a significant correlation between data obtained using LSCI and ICG-FA, when ICG-FA data are presented as AUC of the ICG-FA intensity curve. Maximum slope lacks significant correlation with flap data obtained with LSCI. The study indicates that LSCI may be used in reconstructive surgery to assess tissue circulation in a way similar to ICG-FA.
Copyright © 2024 The Authors. Published by Wolters Kluwer Health, Inc. on behalf of The American Society of Plastic Surgeons.
Conflict of interest statement
The authors have no financial interest to declare in relation to the content of this article.
Figures
References
-
- Smit JM, Negenborn VL, Jansen SM, et al. Intraoperative evaluation of perfusion in free flap surgery: a systematic review and meta-analysis. Microsurgery. 2018;38:804–818. - PubMed
-
- Smit JM, Zeebregts CJ, Acosta R, et al. Advancements in free flap monitoring in the last decade: a critical review. Plast Reconstr Surg. 2010;125:177–185. - PubMed
-
- Li K, Zhang Z, Nicoli F, et al. Application of indocyanine green in flap surgery: a systematic review. J Reconstr Microsurg. 2018;34:77–86. - PubMed
LinkOut - more resources
Full Text Sources