. 2024 Jul 12:15:1404456.
doi: 10.3389/fgene.2024.1404456. eCollection 2024.

A cross-tissue transcriptome-wide association study identifies new susceptibility genes for frailty

Affiliations

A cross-tissue transcriptome-wide association study identifies new susceptibility genes for frailty

Daoyi Lin et al. Front Genet. .

Abstract

Background: Although genome-wide association studies (GWAS) have identified 14 loci associated with frailty index (FI) susceptibility, the underlying causative genes and biological mechanisms remain elusive. Methods: A cross-tissue transcriptome-wide association study (TWAS) was conducted utilizing the Unified Test for Molecular Markers (UTMOST), which integrates GWAS summary statistics from 164,610 individuals of European ancestry and 10,616 Swedish participants, alongside gene expression matrices from the Genotype-Tissue Expression (GTEx) Project. Validation of the significant genes was performed through three distinct methods: FUSION, FOCUS, and Multiple Marker Analysis of Genome-wide Annotation (MAGMA). Exploration of tissue and functional enrichment for FI-associated SNPs was conducted using MAGMA. Conditional and joint analyses, along with fine mapping, were employed to enhance our understanding of FI's genetic architecture. Mendelian randomization was employed to ascertain causal relationships between significant genes and FI, and co-localization analysis was utilized to investigate shared SNPs between significant genes and FI. Results: In this study, two novel susceptibility genes associated with the risk of FI were identified through the application of four TWAS methods. Mendelian randomization demonstrated that HTT may elevate the risk of developing frailty, whereas LRPPRC could offer protection against the onset of frailty. Additionally, co-localization analysis identified a shared SNP between LRPPRC and FI. Tissue enrichment analyses revealed that genomic regions linked to SNPs associated with frailty were predominantly enriched in various brain regions, including the frontal cortex, cerebral cortex, and cerebellar hemispheres. Conditional, combined analyses, and fine mapping collectively identified two genetic regions associated with frailty: 2p21 and 4q16.3. Functional enrichment analyses revealed that the pathways associated with frailty were primarily related to the MHC complex, PD-1 signaling, cognition, inflammatory response to antigenic stimuli, and the production of second messenger molecules. Conclusion: This investigation uncovers two newly identified genes with forecasted expression levels associated with the risk of FI, offering new perspectives on the genetic architecture underlying FI.

Keywords: TWAS; UTMOST; causal relationship; frailty; mendelian randomization.


Conflict of interest statement

The authors declare that the research was conducted in the absence of any commercial or financial relationships that could be construed as a potential conflict of interest.

Figures

FIGURE 1
FIGURE 1
Overview of the transcriptome-wide association study design of FI. FDR, false discovery rate; GWAS, genome-wide association study; TWAS, transcriptome-wide association study.
FIGURE 2
FIGURE 2
Manhattan plot of the cross-tissue transcriptome-wide association results for FI. 107 genes was specifically associated with the risk of FI. The y-axis represents p-value in –log(10) scale. A significance threshold after FDR-correction was used.
FIGURE 3
FIGURE 3
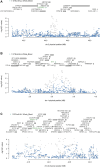
Conditional and joint analyses of FI (A) Chromosome 2p21 regional association plot. (B) Chromosome 4q16.3 regional association plot. (C) Chromosome 22q13.2 regional association plot. Genes independently associated with FI are highlighted in green. SNPs associated with FI before conditional analysis are highlighted in grey, and secondary SNPs associated with FI after conditional analysis are highlighted in blue.
FIGURE 4
FIGURE 4
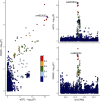
FOCUS plot for each gene in one region. (A) The plot contains the predicted expression correlation, TWAS summary statistics, and PIP for each gene in the genomic locus Chr2: 43996004–43996005 in the whole blood. (B) The plot contains the predicted expression correlation, TWAS summary statistics, and PIP for each gene in the genomic locus Chr4: 3074680–3074681 in the whole blood.
FIGURE 5
FIGURE 5
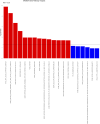
Significant types of pathways in terms of the GO and KEGG enrichment analyses through KEGG. BP, biological process; CC, cellular component; MF, molecular function; KEGG: KEGG pathways.
FIGURE 6
FIGURE 6
Venn plot reveals the overlap of the significant genes identified by four different methods with FDR < 0.05.
FIGURE 7
FIGURE 7
Colocation of eQTL and GWAS associations in LRPPRC. Scatterplot illustrating the overlap of GWAS and eQTL associations for LRPPRC. The y-axis represents GWAS p-values on a log10 scale for FI. The x-axis represents eQTL p-values on a −log10 scale for LRPPRC. The degree of linkage disequilibrium for all SNPs with rs4953032 is indicated by color.
FIGURE 8
FIGURE 8
Bi-directional Mendelian Randomization (MR) analyses between LRPPRC/HTT and FI (Causal effect of LRPPRC/HTT on FI). Estimates and 95% CI were represented with square plots and error bars.

Similar articles

Cited by

References

    1. Arleo A., Bareš M., Bernard J. A., Bogoian H. R., Bruchhage M., Bryant P., et al. (2023). Consensus paper: cerebellum and ageing. Cerebellum 23, 802–832. 10.1007/s12311-023-01577-7 - DOI - PMC - PubMed
    1. Atkins J. L., Jylhävä J., Pedersen N. L., Magnusson P. K., Lu Y., Wang Y., et al. (2021). A genome-wide association study of the frailty index highlights brain pathways in ageing. Aging Cell 20 (9), e13459. 10.1111/acel.13459 - DOI - PMC - PubMed
    1. Barros D., Marques E. A., Magalhães J., Carvalho J. (2022). Energy metabolism and frailty: the potential role of exercise-induced myokines - a narrative review. Ageing Res. Rev. 82, 82101780. 10.1016/j.arr.2022.101780 - DOI - PubMed
    1. Burgess S., Small D. S., Thompson S. G. (2017). A review of instrumental variable estimators for Mendelian randomization. Stat. Methods Med. Res. 26 (5), 2333–2355. 10.1177/0962280215597579 - DOI - PMC - PubMed
    1. Byrne E. M., Zhu Z., Qi T., Skene N. G., Bryois J., Pardinas A. F., et al. (2021). Conditional GWAS analysis to identify disorder-specific SNPs for psychiatric disorders. Mol. Psychiatry 26 (6), 2070–2081. 10.1038/s41380-020-0705-9 - DOI - PMC - PubMed

LinkOut - more resources