. 2022;14(3):263-276.

Comparison of neighborhood deprivation index and food desert status as environmental predictors of early childhood obesity

Affiliations

Comparison of neighborhood deprivation index and food desert status as environmental predictors of early childhood obesity

Shannon C Conrey et al. Int Public Health J. 2022.

Abstract

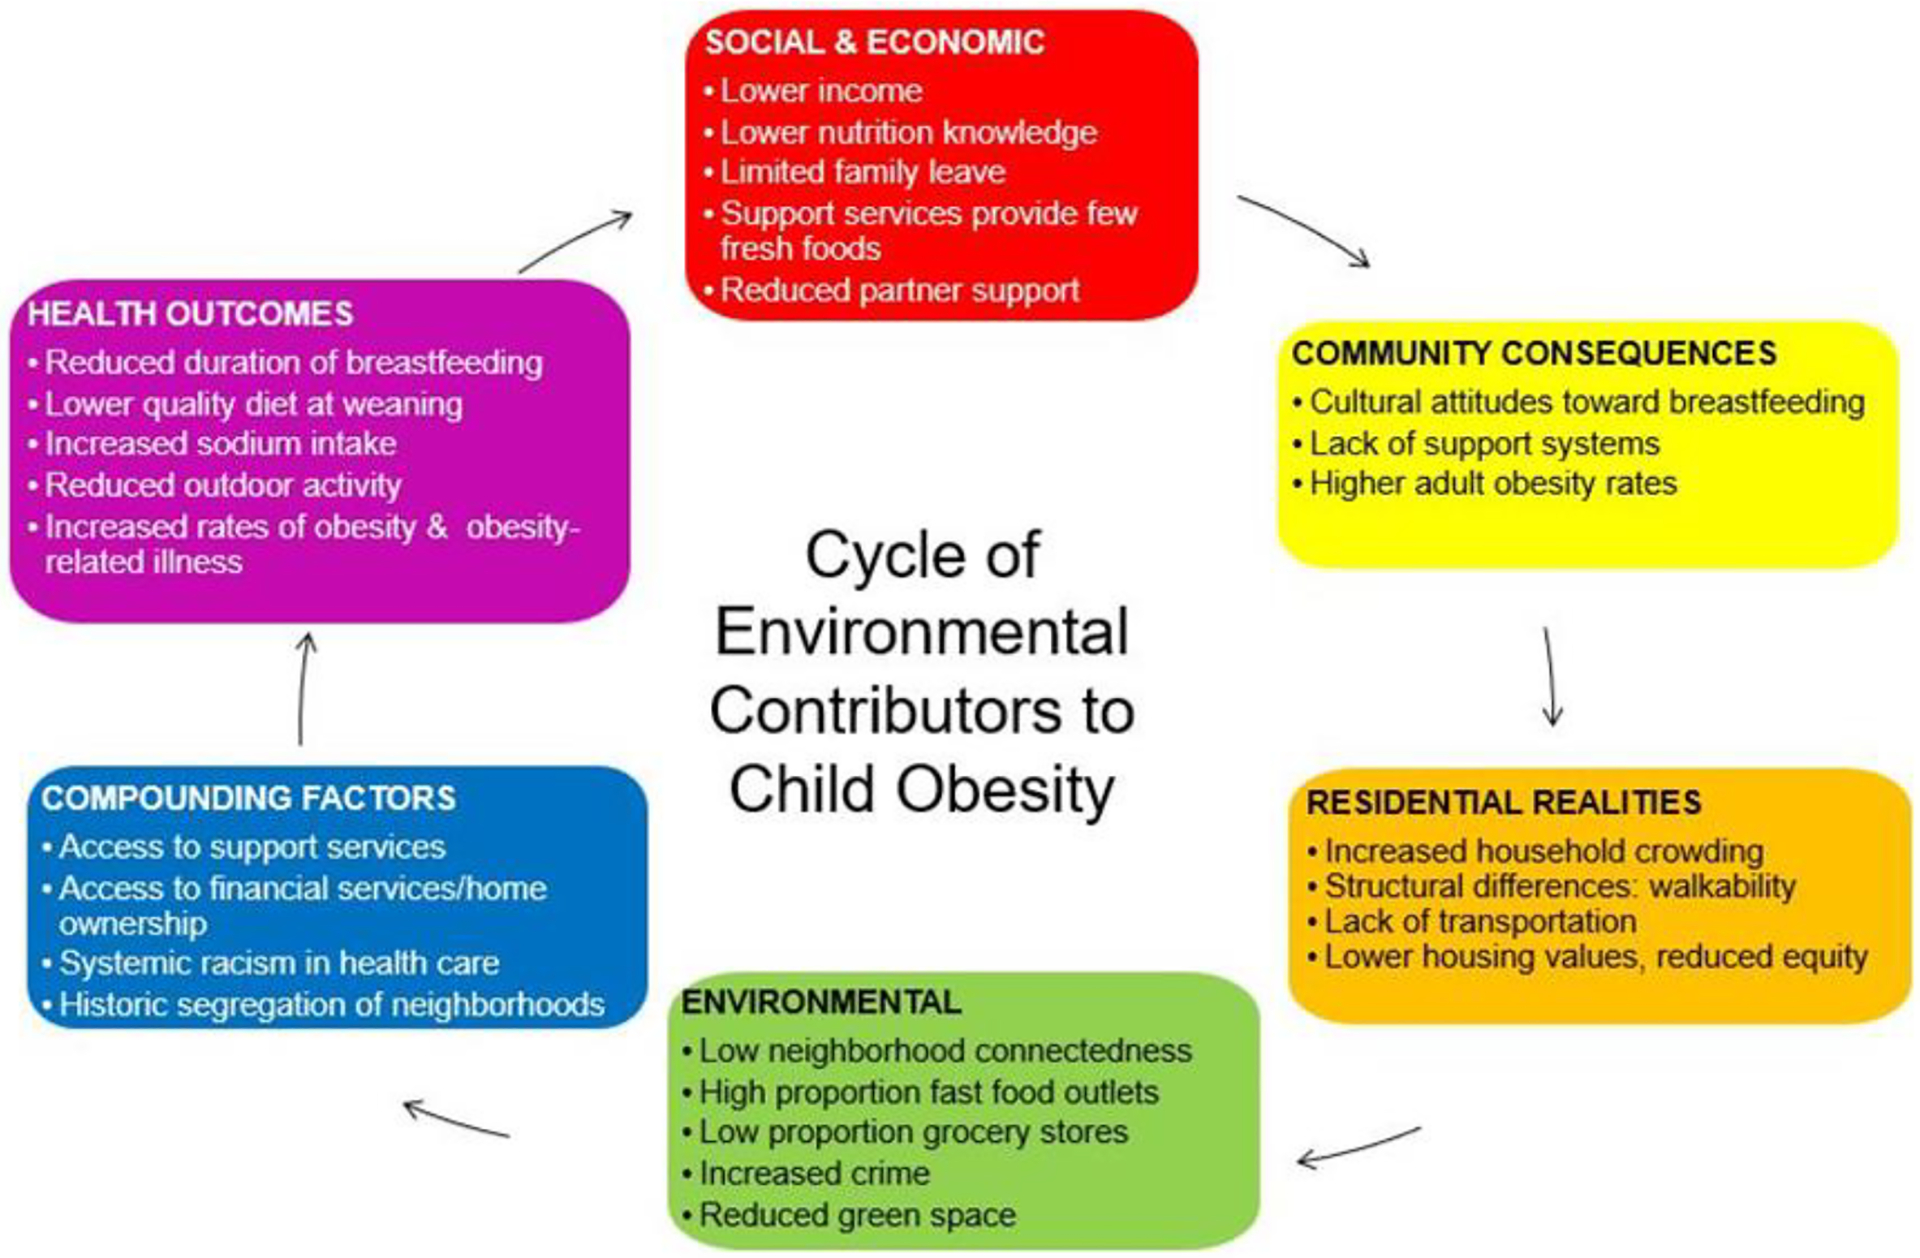
Nearly 14% of American children aged 2-5 have obesity, with higher rates in children from lower-income and Black families. While evidence connects neighborhood socioeconomic environment (SEE) and obesity in adults and adolescents, little is known of this relationship in young children. We compared measures of SEE and family-level socio-demographic factors as predictors of obesity at age two.

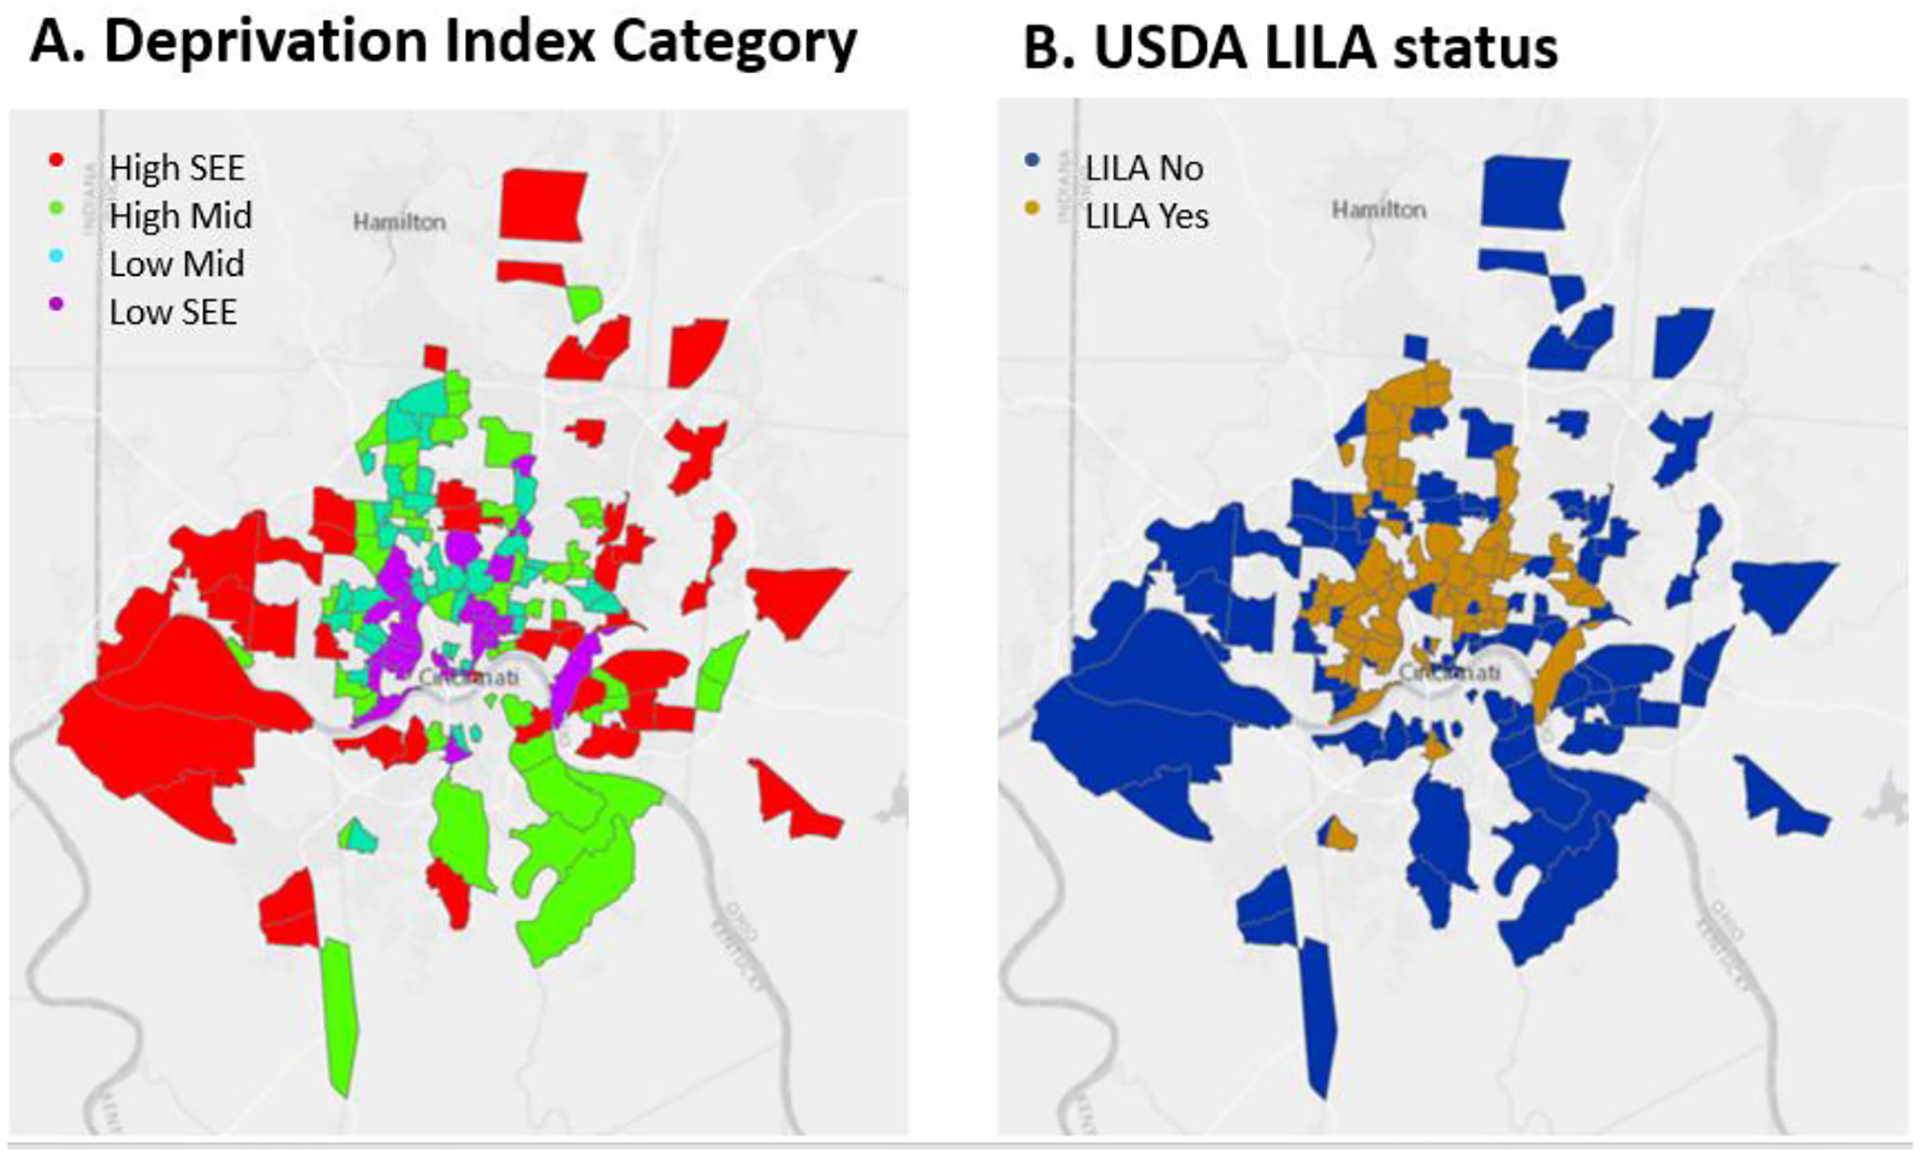
Methods: Family-level data from the PREVAIL Cohort, a CDC-funded birth cohort in Cincinnati, Ohio, were collected prenatally from the mothers. Residential addresses were geocoded and assigned validated measures of census tract-level SEE, including USDA food desert indicators and the Deprivation Index. Family-level and ecological SEE were compared as predictors of obesity (BMIz ≥1.65) at age two in terms of proportional differences, relative risk, and model fit statistics.

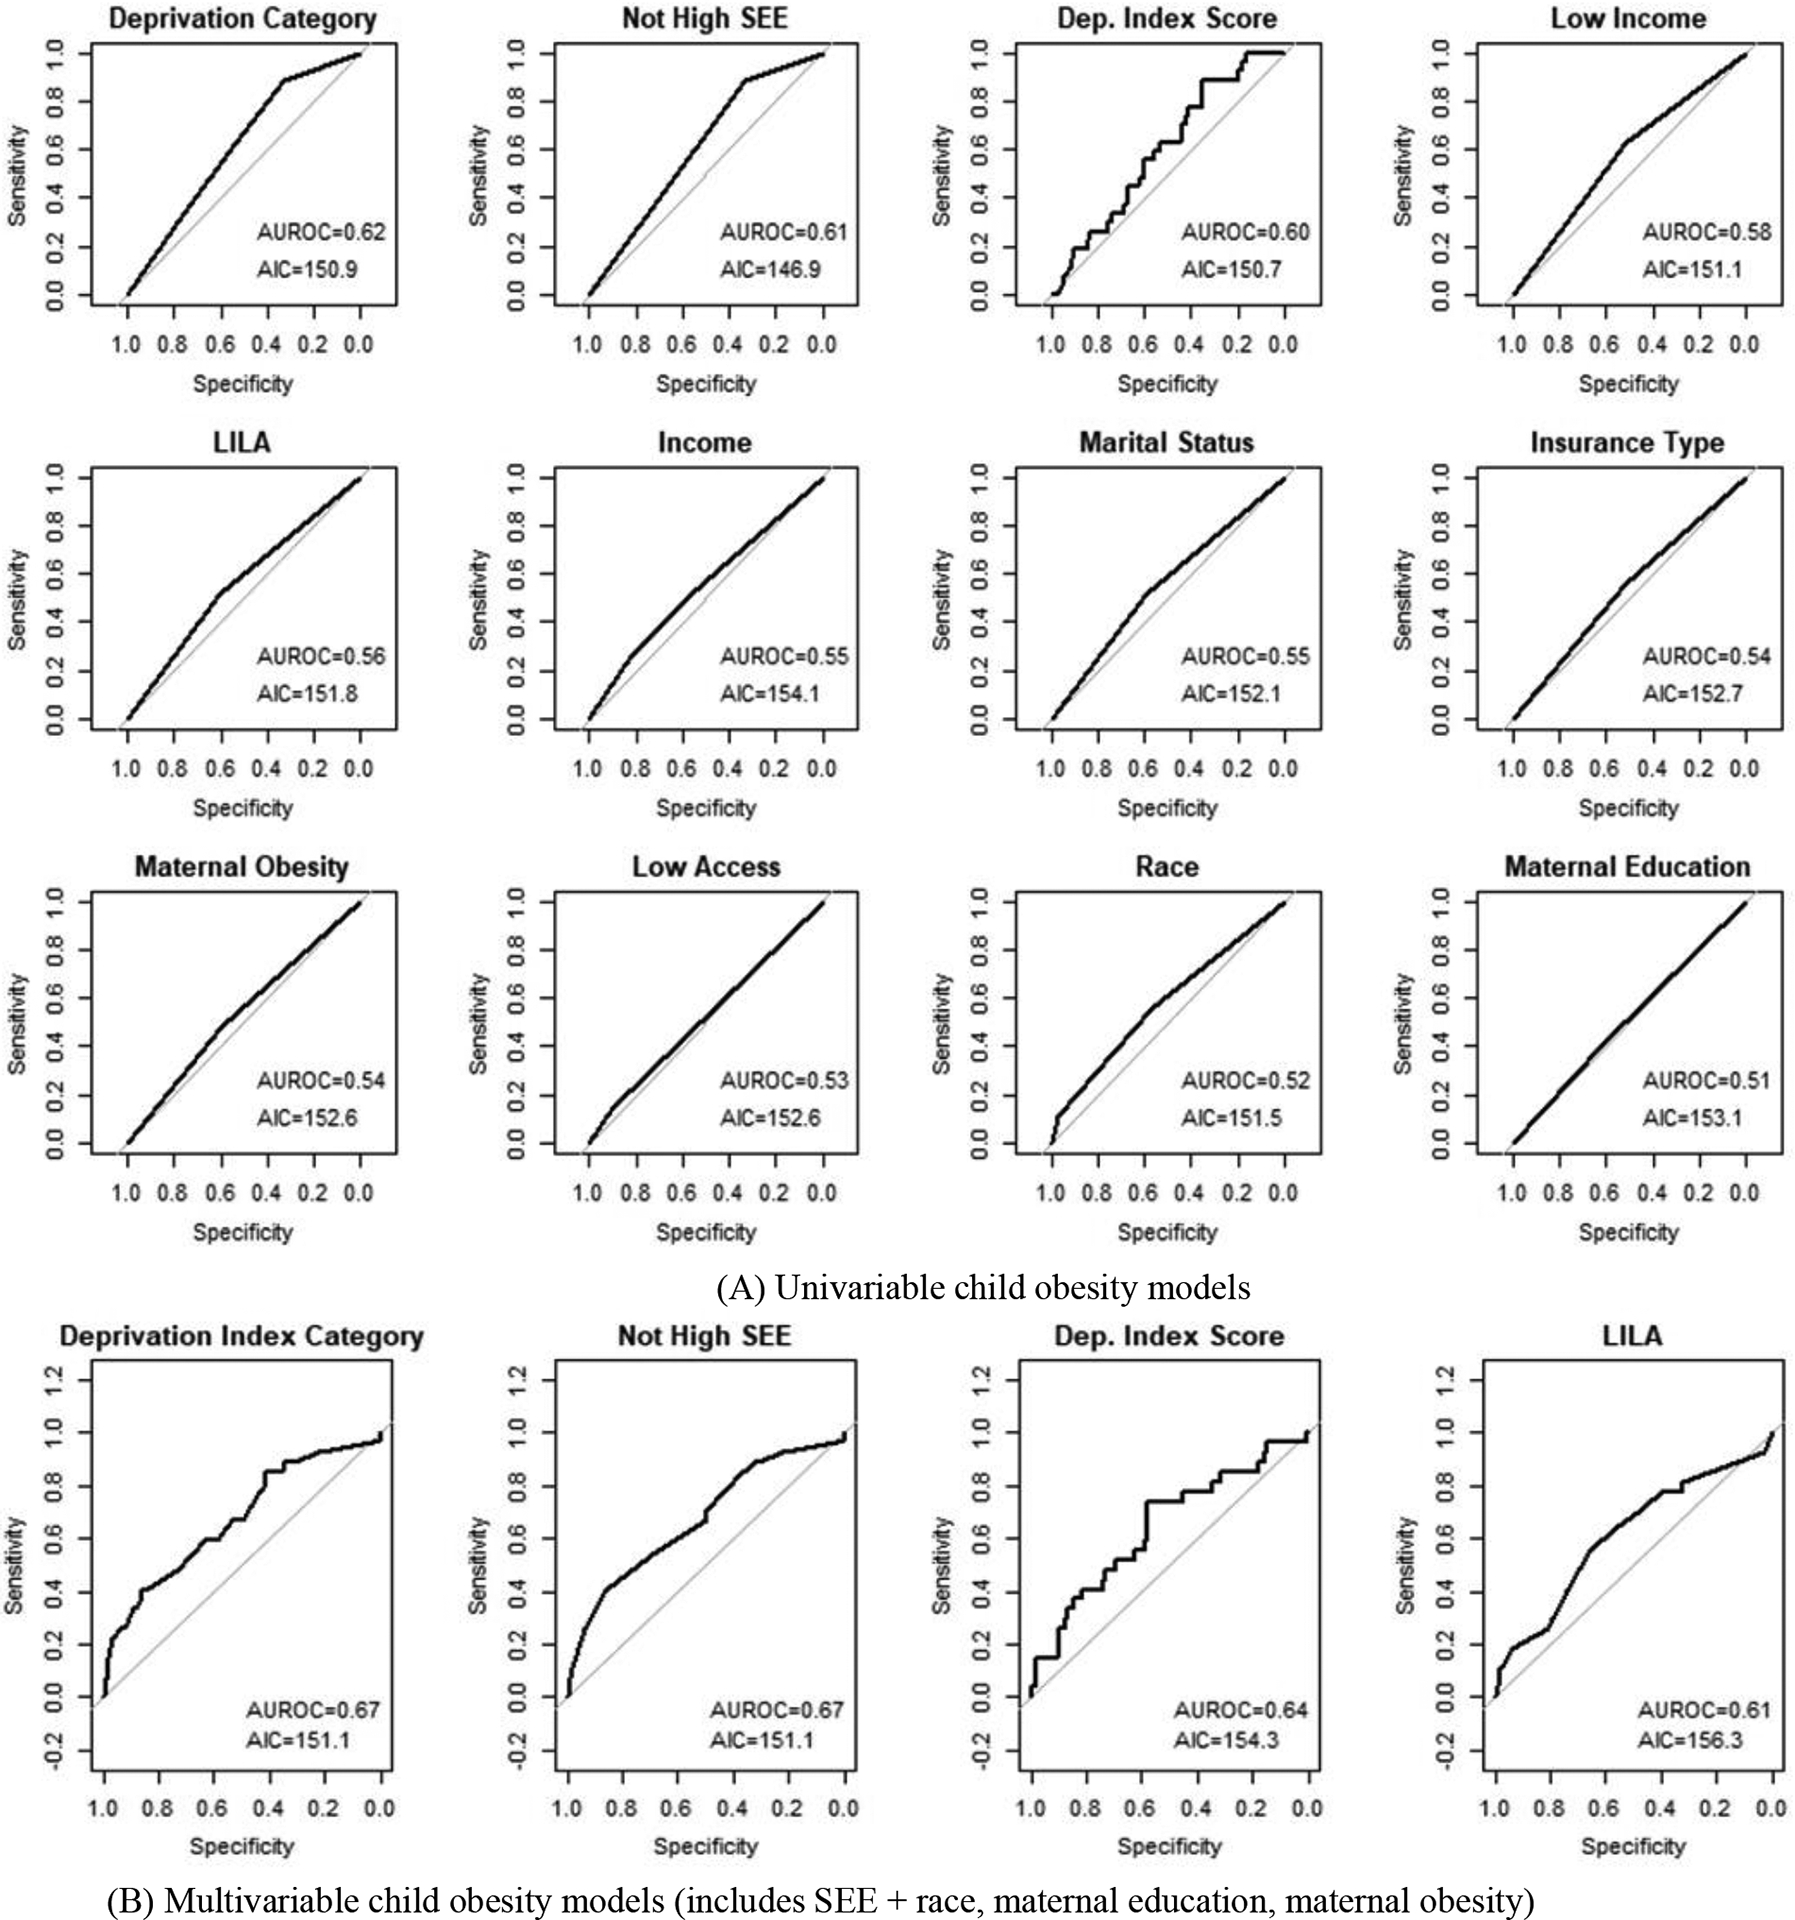
Results: Residing outside of Deprivation Index High SEE neighborhoods was significantly associated with higher proportion (20.0% vs 5.9%; χ2 = 4.36, p = 0.037) and increased risk of obesity in univariable (RR = 3.4, 95%CI: 1.26-13.86) and multivariable models (RR = 3.5, 95%CI: 1.06-11.71). There were no differences in proportion or risk of obesity by USDA food desert indicators or family-level factors. Models using categorical Deprivation Index performed better than the family-level and the USDA food desert variables in terms of model fit.

Conclusion: In the PREVAIL Cohort, only category of Deprivation Index was a significant predictor of obesity in two-year-old children. Future studies are needed to evaluate the Deprivation Index as a generalizable tool to identify neighborhoods at higher risk for obesity.

Keywords: childhood obesity; food deserts; neighborhood deprivation; social determinants of health.


Figures

Figure 1.
Figure 1.
The environmental influences on childhood obesity. Childhood obesity is intimately linked to social, racial and economic differences in neighborhood environments (12). These differences contribute in myriad ways to a cycle of obesity and obesity-related comorbidities in low income and minority populations. While evidence of food access as a contributor to early childhood obesity has been mixed (17, 18) environmental factors, such as green space, neighborhood safety, and access to health care, are shown to predict obesity status in older children and adults (7, 8), while individual factors, such as race and income, are associated with both one’s residential neighborhood and obesity risk (11, 15).
Figure 2.
Figure 2.
Maps of the PREVAIL Cohort catchment area categorized by measures of census tract socio-economic environment. Maps of census tracts included in the PREVAIL Cohort, a CDC-funded birth cohort in Cincinnati, OH, color-coded by Deprivation Index Category (A) and USDA Low Income/Low Access (LILA, B) status. Residential addresses were geocoded to the census tract level and assigned Deprivation Index (21) and USDA Food Access Research Atlas (20) indicators of socio-economic environment (SEE). Deprivation Index category was assigned based on quartile of score, with the lowest quartile of scores indicating the least deprived census tracts (High SEE) and highest quartile of scores designated as the most deprived census tracts (Low SEE). LILA designation was used to identify census tracts that met both USDA Low Income and Low Access criteria, a frequently used food desert indicator.
Figure 3.
Figure 3.
Area under the receiver operator characteristic curves for log binomial obesity models in the PREVAIL Cohort. Visualizations of areas under the receiver characteristic curves (AUROC) for log binomial models of obesity risk in two-year-old children enrolled in the PREVAIL Cohort. Residential addresses were geocoded and assigned two validated measures of census tract socio-economic environment (SEE), the Deprivation Index (21) and the USDA Food Access Research Atlas variables Low Income, Low Access, and Low Income/Low Access (LILA) (20). Deprivation Index categories were assigned based on quartile of Deprivation Index score. A binary comparison of the Least Deprived quartile compared to the remaining cohort was also included. Family-level factors were collected at the baseline study visit from the mother. Univariable models assessed risk of obesity at age two by each variable. Multivariable models included measures of SEE and the family-level variables of maternal race, education level, and presence of obesity. Model fit was compared for univariable (A) and multivariable (B) models using Akaike Information criteria (AIC) and area under the receiver operator characteristic curve (AUROC), with lower AIC and higher AUROC indicating better model fit, and an AUROC ≥0.70 considered adequate predictive accuracy.

Similar articles

References

    1. Kelsey MM, Zaepfel A, Bjornstad P, Nadeau KJ. Age-related consequences of childhood obesity. Gerontology 2014;60(3):222–8. - PubMed
    1. Llewellyn A, Simmonds M, Owen CG, Woolacott N. Childhood obesity as a predictor of morbidity in adulthood: a systematic review and meta-analysis. Obes Rev 2016;17(1):56–67. - PubMed
    1. Ogden C, Fryar C, Martin C, Freedman D, Carroll M, Gu Q, et al. Trends in obesity prevalence by race and Hispanic origin—1999–2000 to 2017–2018. JAMA 2020;324(12):1208–10. - PMC - PubMed
    1. Hales C, Carroll M, Fryar C, Ogden C. Prevalence of obesity and severe obesity among adults: United States, 2017–2018. NCHS Data Brief. Hyattsville, MD: National Center for Health Statistics, 2020:360. - PubMed
    1. Ogden C, Carroll M, Fakhouri T, Hales C, Fryar C, Li X, et al. Prevalence of obesity among youths by household income and education level of head of household — United States 2011–2014. MMWR 2018; 67:186–9. - PMC - PubMed

LinkOut - more resources