. 2024 Jul 12:12:1022181.
doi: 10.3389/fcell.2024.1022181. eCollection 2024.

Disease-associated gut microbiome and metabolome changes in rats with chronic hypoxia-induced pulmonary hypertension

Affiliations

Disease-associated gut microbiome and metabolome changes in rats with chronic hypoxia-induced pulmonary hypertension

Weitao Cao et al. Front Cell Dev Biol. .

Abstract

Background: Pulmonary hypertension (PH) is a progressive disease affecting the lung vasculature that is characterized by sustained vasoconstriction and leads to vascular remodeling. The lung microbiome contributes to PH progression, but the function of the gut microbiome and the correlation between the gut microbiome and metabolome remain unclear. We have analyzed whether chronic hypoxia-induced PH alters the rat fecal microbiota.

Purpose: We explored hypoxia-induced pulmonary hypertension model rats to find out the characteristic changes of intestinal microorganisms and metabolites of hypoxia-induced pulmonary hypertension, and provide a theoretical basis for clinical treatment.

Methods: In the current study, a chronic hypoxia-induced PH rat model was used to investigate the role of the gut microbiome and metabolome as a potential mechanism contributing to the occurrence and development of PH. 16S ribosomal ribonucleic acid (16S rRNA), short-chain fatty acid (SCFA) measurements, mass spectrometry (MS) metabolomics analysis and metatranscriptome were performed to analyze stool samples. The datasets were analyzed individually and integrated for combined analysis using bioinformatics approaches.

Results: Our results suggest that the gut microbiome and metabolome of chronic hypoxia-induced PH rats are distinct from those of normoxic rats and may thus aid in the search for new therapeutic or diagnostic paradigms for PH.

Conclusion: The gut microbiome and metabolome are altered as a result of chronic hypoxia-induced PH. This imbalanced bacterial ecosystem might play a pathophysiological role in PH by altering homeostasis.

Keywords: SCFAs; chronic hypoxia; gut metabolome; gut microbiome; pH.


Conflict of interest statement

The authors declare that the research was conducted in the absence of any commercial or financial relationships that could be construed as a potential conflict of interest.

Figures

FIGURE 1
FIGURE 1
Intestinal microbial diversity and composition in the normoxia group and hypoxia-induced PH group. Differences in RVSP (A) and RVHI (B) between the two groups. Variation in diversity within the two groups by ACE (C) and Chao1 index (D). NMDS plots based on (E). Average relative abundances of dominant bacterial phyla (F), classes (G), and genera (H) in the intestine within the two groups. Normoxia group, n = 15; hypoxia-induced PH group, n = 14.
FIGURE 2
FIGURE 2
Differentially expressed genes involved in the pathogenicity of intestinal bacteria in the normoxia and hypoxia-induced PH groups. (A) Enriched genes involved in regulation. (B) Enriched genes listed in the heatmap. Normoxia group, n = 15; hypoxia-induced PH group, n = 14.
FIGURE 3
FIGURE 3
Changes in SCFAs in rats with chronic hypoxia-induced PH. The levels of isovaleric acid (A) and valeric acid (B) measured by GC‒MS in the normoxia group and hypoxia-induced PH group. The values are presented as the means ± SDs, *p < 0.05. Normoxia group, n = 15; hypoxia-induced PH group, n = 14.
FIGURE 4
FIGURE 4
The effect of interference on the fecal metabolome. Typical LC–MS total ion current (TIC) chromatograms of nontarget metabonomics from the normoxia and hypoxia-induced PH groups in positive mode (A) and negative mode (B). (C) PLS-DA score plot of positive ions. (D) Permutation testing of positive ions. (E) PLS-DA score plot of negative ions. (F) Permutation testing of negative ions. (G) Fecal metabolite disorder between the normoxia and hypoxia-induced PH groups. The data are presented as the mean ± SD, and significant differences between groups are indicated as ***p < 0.001, **p < 0.01 and *p < 0.05. Normoxia group, n = 15; hypoxia-induced PH group, n = 14.
FIGURE 5
FIGURE 5
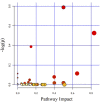
The KEGG pathways enriched and analyzed. Ingenuity pathway analysis. The size and color are based on the p-value and impact value, and a small p-value and large pathway impact value indicate that the pathway is greatly influenced.
FIGURE 6
FIGURE 6
Relationship between the gut microbiome and host metabolome. (A) Heatmaps indicate positive (red) and negative (blue) correlations between the levels of host metabolites and the identified gut microbes at the genus level of normoxia rats compared with hypoxia-induced PH rats. The legend shows correlation values from −1 to 1 and assigns the appropriate color to them (red for positive correlations and blue for negative correlations). (B) Redundancy analysis between the levels of host metabolites and the identified gut microbiome at the genus level in normoxic rats compared with hypoxia-induced PH rats. There is an acute angle between the two variables, which represents a positive correlation, and there is a synergistic effect; there is an obtuse angle between the two variables, which represents a negative correlation, and there is an antagonistic effect. Normoxia group, n = 15; hypoxia-induced PH group, n = 14.
FIGURE 7
FIGURE 7
Metatranscriptome in intestinal microbial diversity and composition in the normoxia group and hypoxia-induced PH group. Variation in diversity within the two groups by ACE (A,B) Chao1 index. NMDS plots based on (C). Average relative abundances of dominant bacterial phyla (D), classes (E), and genera (F) in the intestine within the two groups. Normoxia group, n = 5; hypoxia-induced PH group, n = 5.
FIGURE 8
FIGURE 8
Metatranscriptomic analysis of intestinal microbial gene changes and functional changes in normoxia group and hypoxia-induced PH group. (A) Enriched genes involved in regulation. (B) PLS-DA analyzed differential metabolites between the two groups. (C) Differential functional unit clustering heat map. (D) KEGG metabolic pathway enrichment analysis. Normoxia group, n = 5; hypoxia-induced PH group, n = 5.

Similar articles

Cited by

References

    1. Arseneau J. R., Steeves R., Laflamme M. (2017). Modified low-salt CTAB extraction of high-quality DNA from contaminant-rich tissues. Mol. Ecol. Resour. 17 (4), 686–693. 10.1111/1755-0998.12616 - DOI - PubMed
    1. Bolignano D., Rastelli S., Agarwal R., Fliser D., Massy Z., Ortiz A., et al. (2013). Pulmonary hypertension in CKD. Am. J. Kidney Dis. 61 (4), 612–622. 10.1053/j.ajkd.2012.07.029 - DOI - PubMed
    1. Boronat A., Mateus J., Soldevila-Domenech N., Guerra M., Rodríguez-Morató J., Varon C., et al. (2019). Cardiovascular benefits of tyrosol and its endogenous conversion into hydroxytyrosol in humans. A randomized, controlled trial. Free Radic. Biol. Med. 143, 471–481. 10.1016/j.freeradbiomed.2019.08.032 - DOI - PubMed
    1. Bowerman K. L., Rehman S. F., Vaughan A., Lachner N., Budden K. F., Kim R. Y., et al. (2020). Disease-associated gut microbiome and metabolome changes in patients with chronic obstructive pulmonary disease. Nat. Commun. 11 (1), 5886. 10.1038/s41467-020-19701-0 - DOI - PMC - PubMed
    1. Budden K. F., Shukla S. D., Rehman S. F., Bowerman K. L., Keely S., Hugenholtz P., et al. (2019). Functional effects of the microbiota in chronic respiratory disease. Lancet Respir. Med. 7 (10), 907–920. 10.1016/S2213-2600(18)30510-1 - DOI - PubMed

LinkOut - more resources