[Preprint]. 2024 Jul 16:2024.07.14.24310395.
doi: 10.1101/2024.07.14.24310395.

Lost in Transplantation: Characterizing Racial Gaps in Physician Organ Offer Acceptance

Affiliations

Lost in Transplantation: Characterizing Racial Gaps in Physician Organ Offer Acceptance

Hammaad Adam et al. medRxiv. .

Abstract

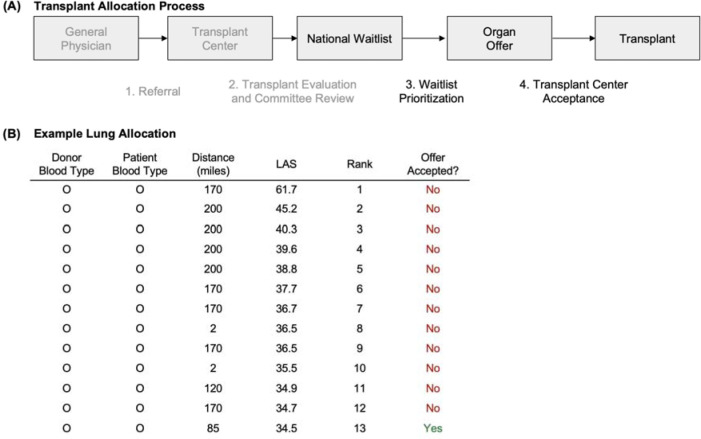
Background: There are known racial disparities in the organ transplant allocation system in the United States. However, prior work has yet to establish if transplant center decisions on offer acceptance-the final step in the allocation process-contribute to these disparities.

Objective: To estimate racial differences in the acceptance of organ offers by transplant center physicians on behalf of their patients.

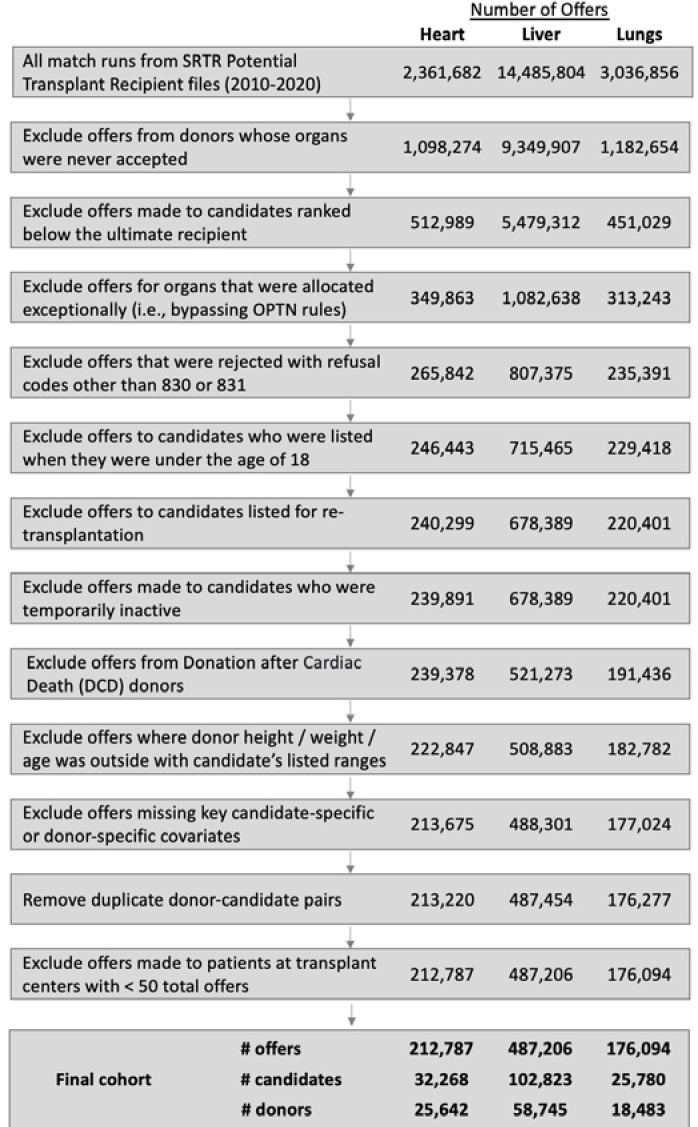
Design: Retrospective cohort analysis using data from the Scientific Registry of Transplant Recipients (SRTR) on patients who received an offer for a heart, liver, or lung transplant between January 1, 2010 and December 31, 2020.

Setting: Nationwide, waitlist-based.

Patients: 32,268 heart transplant candidates, 102,823 liver candidates, and 25,780 lung candidates, all aged 18 or older.

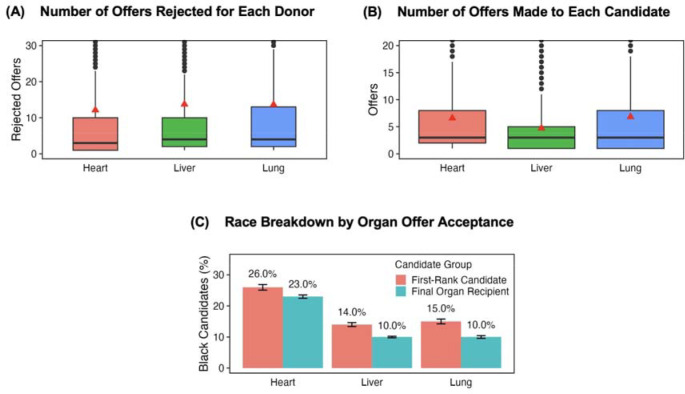
Measurements: 1) Association between offer acceptance and two race-based variables: candidate race and donor-candidate race match; 2) association between offer rejection and time to patient mortality.

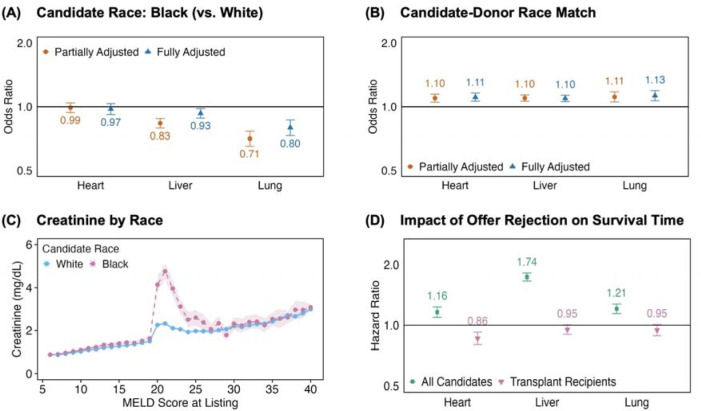
Results: Black race was associated with significantly lower odds of offer acceptance for livers (OR=0.93, CI: 0.88-0.98) and lungs (OR=0.80, CI: 0.73-0.87). Donor-candidate race match was associated with significantly higher odds of offer acceptance for hearts (OR=1.11, CI: 1.06-1.16), livers (OR=1.10, CI: 1.06-1.13), and lungs (OR=1.13, CI: 1.07-1.19). Rejecting an offer was associated with lower survival times for all three organs (heart hazard ratio=1.16, CI: 1.09-1.23; liver HR=1.74, CI: 1.66-1.82; lung HR=1.21, CI: 1.15-1.28).

Limitations: Our study analyzed the observational SRTR dataset, which has known limitations.

Conclusion: Offer acceptance decisions are associated with inequity in the organ allocation system. Our findings demonstrate the additional barriers that Black patients face in accessing organ transplants and demonstrate the need for standardized practice, continuous distribution policies, and better organ procurement.


Conflict of interest statement

Conflicts of interest Authors declare that they have no conflicts of interests.

Figures

Figure 1.
Figure 1.. Overview of organ transplant allocation in the United States.
A) Process to receive an organ transplant in the US. Patients are referred to a transplant center by a general physician. The transplant center evaluates the referral and if appropriate, convenes a multi-disciplinary clinical committee to determine candidacy for organ transplantation. If the patient is deemed to be a suitable transplant candidate, they are placed on a national waitlist. Medically compatible organs are offered to candidate recipients on the waitlist in order of a standardized allocation score or status. Once an offer is made, a transplant center physician decides whether to accept the organ on a candidate’s behalf. This final step means that top-ranked candidates do not always receive organs before lower-ranked candidates. Note that the first two steps are shown in gray, as data is only publicly available beyond this point. B) An example of lung allocation (from SRTR). The waitlist was ranked using blood type, distance between the donor and candidate, and the lung allocation score (LAS). All displayed candidates had the same blood type and distance bucket (< 250 miles), and so priority was determined by LAS alone. The thirteenth candidate on the waitlist received this organ for transplant, as physicians for the twelve higher-ranked candidates all rejected the offer.
Figure 2.
Figure 2.. Cohort selection.
We considered all offers made to patients on the waitlist for heart, liver, and lung transplants between January 1, 2010 and December 31, 2020. We excluded marginal organs that were not accepted by any candidate they were offered to. We excluded offers made to candidates ranked below the ultimate recipient in the waiting list, as these decisions were provisional and could be changed. We further excluded offers for organs that were allocated exceptionally (i.e. bypassing OPTN rules). To focus on decisions made based on observable characteristics and for non-logistical reasons, we only included rejected offers that were rejected for donor age or quality (code 830) or donor size or weight (code 831). We then excluded complex scenarios that required specialized decision-making and were not representative of a typical offer: this excluded candidates listed when they were under the age of 18, candidates listed for re-transplantation, heart candidates who were temporarily inactive, and organs donated after cardiac death (DCD). We did not include offers made to candidates where the donor did not meet their compatible age, weight, or height ranges (specified at the time of waitlisting), as these offers were rejected due to pre-specified criteria and did not require a physician decision at the time of offer. Finally, we excluded offers missing key candidate or donor covariates and offers made to patients at transplant centers with less than 50 total offers; this allowed us to adequately control for observed clinical features and center-level behavior respectively.
Figure 3.
Figure 3.. Organ offer acceptance patterns
A) Distribution of the number of offers rejected before an organ is accepted for its final recipient. The plot displays the mean (red triangle), median (black line), and interquartile range (box) of the number of offers rejected. On average, between eleven and fifteen candidates (depending on the organ type) reject an organ before it is accepted for its recipient. B) Distribution of the number of offers received by each candidate in our cohort. The plot displays the mean (red triangle), median (black line), and interquartile range (box). On average, a candidate in our cohort receives between five and seven offers before they either accept (and receive a transplant) or are removed from the waitlist (e.g., due to death). C) Racial disparities between final organ recipients and first-ranked candidates for each donated organ. A significantly higher proportion of first-ranked candidates are Black compared to actual recipients for liver and lung transplants (p < 0.001, chi-squared test). The error bars denote the 95% confidence intervals of the proportion (calculated using the normal approximation to the binomial distribution).
Figure 4.
Figure 4.. Modeling organ transplant offer acceptance and patient survival.
A) Odds ratios for the association between Black candidate race and offer acceptance. Black race is associated with significantly lower liver and lung offer acceptance in the partially adjusted and fully adjusted models. We plot odds ratios (on a log-scale) from multivariable logistic regressions modeling offer acceptance. Error bars denote 95% confidence intervals derived from cluster-robust standard errors (clustering by candidate and donor). B) Odds ratios for the association between donor-candidate race match and offer acceptance. A donor-candidate race match is associated with significantly higher odds of offer acceptance for all three organ types. We plot odds ratios (on a log-scale) from multivariable logistic regressions modeling offer acceptance. Error bars denote 95% confidence intervals, calculated using cluster-robust standard errors (clustering by candidate and donor). C) Mean serum creatinine levels by MELD score at listing for Black and White candidates in our liver cohort. On average, Black patients have higher levels of creatinine than White patients with the same MELD score, particularly in the 19–24 point range. The shaded bands display 95% confidence intervals of the mean. D) Hazard ratios for the impact of offer rejection on time to mortality. Candidates with rejected offers have increased mortality risk than similarly ill candidates with accepted offers (“All Candidates” group). Even if the rejecting candidate ultimately received a transplant (“Transplant Recipients” group), they did not receive significantly higher survival benefit from the future accepted organ than the present rejected organ. We plot hazard ratios (on a log-scale) from stratified Cox proportional hazards models. Error bars denote 95% confidence intervals calculated using robust standard errors.

Similar articles

References

    1. Based on OPTN data as of January 16, 2023.
    1. Nephew LD, Serper M. Racial, Gender, and Socioeconomic Disparities in Liver Transplantation. Liver Transpl. 2021;27(6):900–912. - PubMed
    1. Chouairi F, Fuery M, Clark KA, et al. Evaluation of Racial and Ethnic Disparities in Cardiac Transplantation. J Am Heart Assoc. 2021;10(17):e021067. - PMC - PubMed
    1. Riley LE, Lascano J. Gender and racial disparities in lung transplantation in the United States. J Heart Lung Transplant. 2021;40(9):963–969. - PubMed
    1. Kim WR, Mannalithara A, Heimbach JK, et al. MELD 3.0: The Model for End-Stage Liver Disease Updated for the Modern Era. Gastroenterology. 2021;161(6):1887–1895.e4. - PMC - PubMed

Publication types

LinkOut - more resources