[Preprint]. 2025 Jun 2:2024.07.18.24310649.
doi: 10.1101/2024.07.18.24310649.

Shared and unique 3D genomic features of substance use disorders across multiple cell types

Affiliations

Shared and unique 3D genomic features of substance use disorders across multiple cell types

Khanh B Trang et al. medRxiv. .

Abstract

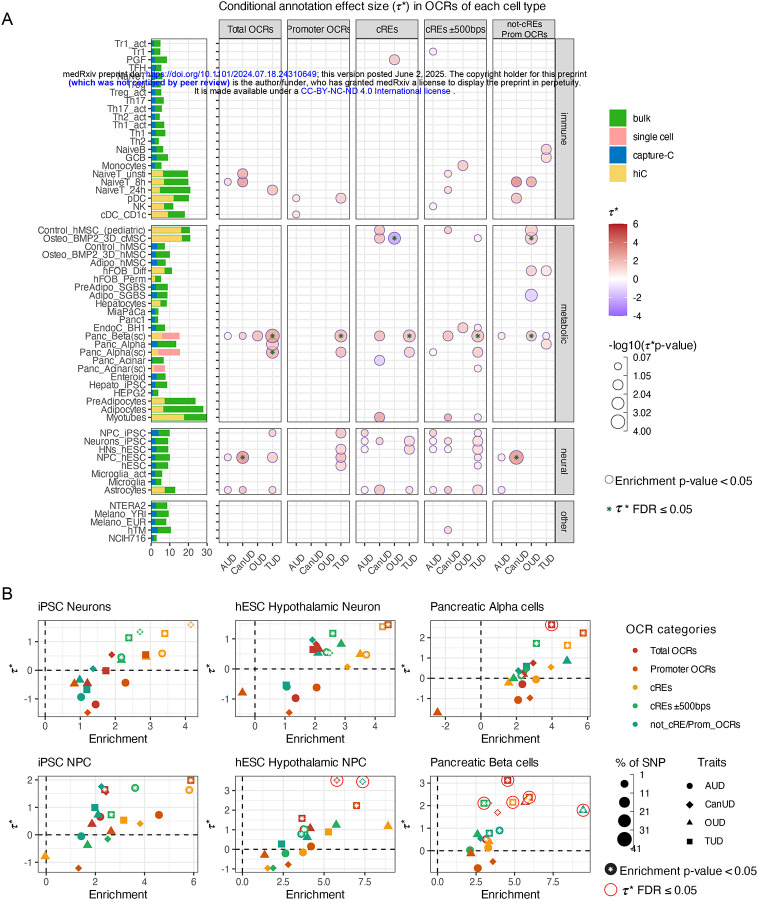
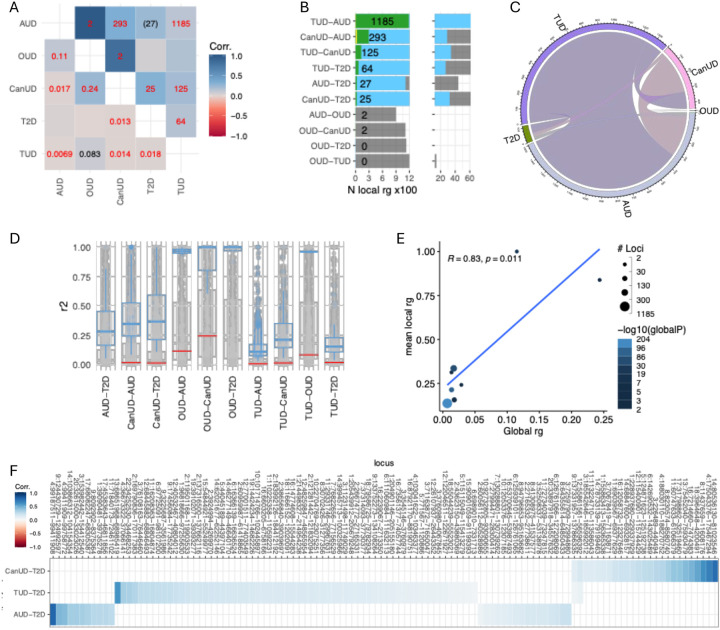
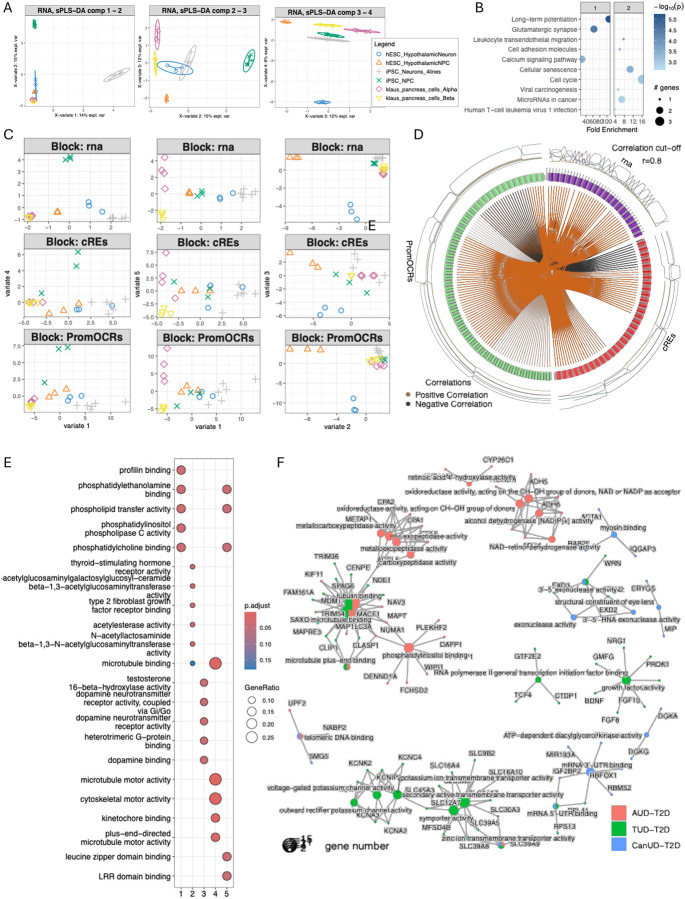
Recent genome-wide association studies (GWAS) revealed shared genetic components among substance use disorders (SUDs). However, the extent of underlying shared causal variants, effector genes, and cellular contexts, remain unclear. We integrated 3D genomic datasets (high-resolution promoter-focused Capture-C/Hi-C, ATAC-seq, RNA-seq) from 59 diverse human cell types with recent GWAS summary statistics for alcohol (AUD), tobacco (TUD), opioid (OUD), and cannabis use disorder (CanUD). Using stratified LD regression, we determined the proportion of SNP heritability attributable to features in these cell types. We observed significant enrichments (P<0.05) in 25 cell types. Heritability reached 4.2-fold enrichment for CanUD in iPSC-derived cortical neurons and 6-fold for AUD/TUD in neural progenitors, confirming their relevance for functional exploration. Additionally, pancreatic cell types, notably insulin-secreted beta cells, showed heritability enrichment for TUD (4.8-fold) and CanUD (5.8-fold), suggesting genomic overlap with metabolic processes. Further investigation revealed significant positive genetic correlations between AUD, TUD, and CanUD with type 2 diabetes (T2D) (FDR<0.05). A multi-omic integrated assessment of T2D-SUD correlated loci revealed strong correlations between gene expression and chromatin accessibility at corresponding cis-regulatory elements and shared functional modules. Our study provides new genomic insights into SUDs and implicates specific cell types for targeted functional follow-up to pinpoint causal variant-gene mechanisms.


Conflict of interest statement

Dr. Kranzler is a member of advisory boards for Altimmune and Clearmind Medicine; a consultant to Sobrera Pharmaceuticals, Altimmune, and Lilly; the recipient of research funding and medication supplies for an investigator-initiated study from Alkermes and a company-initiated study from Altimmune; a member of the American Society of Clinical Psychopharmacology’s Alcohol Clinical Trials Initiative, which was supported in the last three years by Eli Lilly, Imbrium, and Indivior; and an inventor on U.S. provisional patent “Multi-ancestry Genome-wide Association Meta-analysis of Buprenorphine Treatment Response.”

Figures

Figure 1.
Figure 1.. Substance use disorders conditional effect size (τ*) in annotation across diverse cell types.
A. Bar plots (left) depict total number of open chromatin regions (OCR x10,000) identified by bulk (blue) or single-cell (red) ATAC-seq and the proportion of those OCR contacting a gene promoter (putative cRE) as measured by HiC (green) or promoter capture-C (orange). The dot plots depict significant enrichment (p-value ≤ 0.05) within OCR annotations for each cell type across 4 SUDs as determined by S-LDSC analysis. The colors of the dots correspond to conditional effect sizes τ* values, with dots featuring an asterisk indicating FDR ≤ 0.05. The size of the dots corresponds to p-values in −log10. B. Dot plots depicting heritability enrichment (x-axis) and conditional effect sizes τ* (y-axis) for 4 neural and 2 pancreatic cell types, shaped by disorders, colored by annotations, and sized by percentage of contributed SNPs, white asterisks inside dots indicate significant enrichments p-values ≤0.05 and red circles indicate τ* FDR 0.05 from LDSC analysis.
Figure 2.
Figure 2.. Genetic heritability correlations between T2D and SUDs.
A. Correlation matrix between the disorders, lower triangle was for genome-wide scale with values displayed for FDR≤0.05, upper triangle is for the average local correlations with numbers of loci displaying significant FDR≤0.05 correlations; the values are red when the correlations are significant on both genome-wide and local level, black if either. B. Barplot shows numbers of loci tested (grey), found correlated (blue), and reached a significant FDR≤0.05 (green) for each pair-wise of disorders; yellow bars are the number of loci where the CI-95 of correlation between the pair reached 1. C. The chord diagram shows number of significantly correlated loci between 5 disorders. D. Scatter points showing distributions of correlations across loci for each pair of disorders, blue boxplots were significant correlated loci, red lines indicate the correlation level at genome-wide scale. E. Dotplot shows agreement between genome-wide and average local correlations, colored by P-value at genome-wide scale, sized by number of loci. F. Heatmap of 114 loci showed significant correlation between T2D and AUD, TUD and CanUD.
Figure 3.
Figure 3.. Characterization of regulatory landscapes and transcriptomics in neural and pancreatic cells relevant to T2D-SUD overlaps.
A. Cell types projection from sPLS-DA analysis performed using total expression profiles of 6 cell types into 4 optimized components space; ellipse represents 95% confidence intervals around and colored by each sample class; 1st component separated iPSC-derived neurons, 2nd component separated iPSC-derived NPC, 3rd component separated 2 pancreatic cell types and 4th component separated hESC-derived hypothalamus neurons from the rest (more in Fig. S5A) but all combination failed to separate pancreatic cells from neural cell types. B. Enriched pathways from a few genes drove the separation of components 2 and 4 from panel A. C. Sample plot from multiblock DIABLO analysis performed using 3 blocks of RNA-seq profiles and ATAC-seq profiles from Promoter OCRs and cREs within 114 loci displayed significant correlation between T2D and SUDs; the representative 3 combinations of 5 optimized components showed the most separation power, colored similar to panel A: 1st component effectively separated primary lineages (neural progenitors, differentiated neurons, and pancreatic cells), 2nd component focused on distinguishing hESC-derived neural progenitor cells, 3rd component characterized hESC-derived hypothalamic neurons, 4th component separated iPSC-derived neural progenitor cells, 5th component differentiated pancreatic alpha and beta cells and neural cells; similar to panel A, still failed to distinguish pancreatic cell from naurall cell types. D. Circos plot represents the correlations greater than 0.8 between variables of different types, represented on the side quadrants, internal connecting lines show the positive (negative) correlations, the outer lines show the expression levels of each variable in each cell type. E. GO-terms enrichments of genes drove the separations with 5 optimized DIABLO components. F. Network of enriched GO terms with genes from 114 loci, separated by pair-wise correlation between T2D and SUDs.

Similar articles

References

    1. WHO, Global status report on alcohol and health 2018. 2018.
    1. SAMHSA, National Survey on Drug Use and Health. 2022: p. Table 2.25—Alcohol use in lifetime: among people aged 12 or older; by age group and demographic characteristics, 2021 and 2022.
    1. Esser MB S.A., Liu Y, Naimi TS, Deaths from Excessive Alcohol Use — United States, 2016–2021. MMWR and Morbidity and Mortality Weekly Report. p. 154–161. - PMC - PubMed
    1. WHO, WHO global report on trends in prevalence of tobacco use 2000–2025. 2021.
    1. Ahmad FB, C. J., Rossen LM, Sutton P, Provisional drug overdose death counts. 2021, National Vital Statistics System: National Center for Health Statistics.

Publication types