[Preprint]. 2025 Feb 19:2024.07.14.24310393.
doi: 10.1101/2024.07.14.24310393.

Identifying and Forecasting Importation and Asymptomatic Spreaders of Multi-drug Resistant Organisms in Hospital Settings

Affiliations

Identifying and Forecasting Importation and Asymptomatic Spreaders of Multi-drug Resistant Organisms in Hospital Settings

Jiaming Cui et al. medRxiv. .

Update in

Abstract

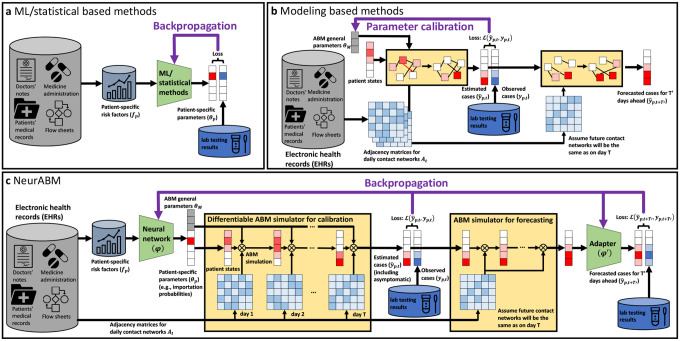
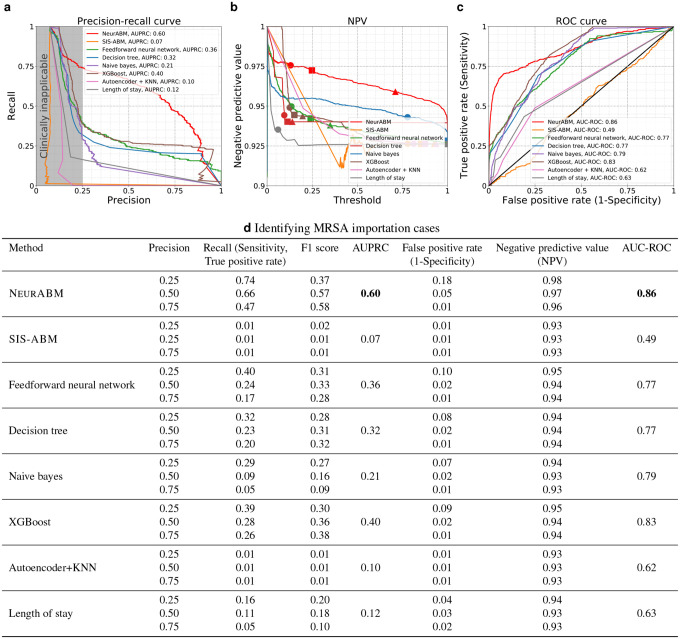
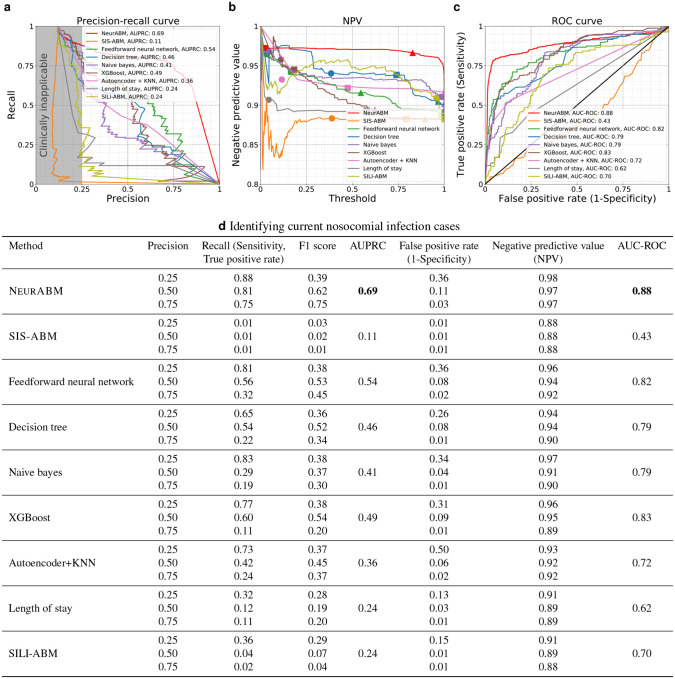
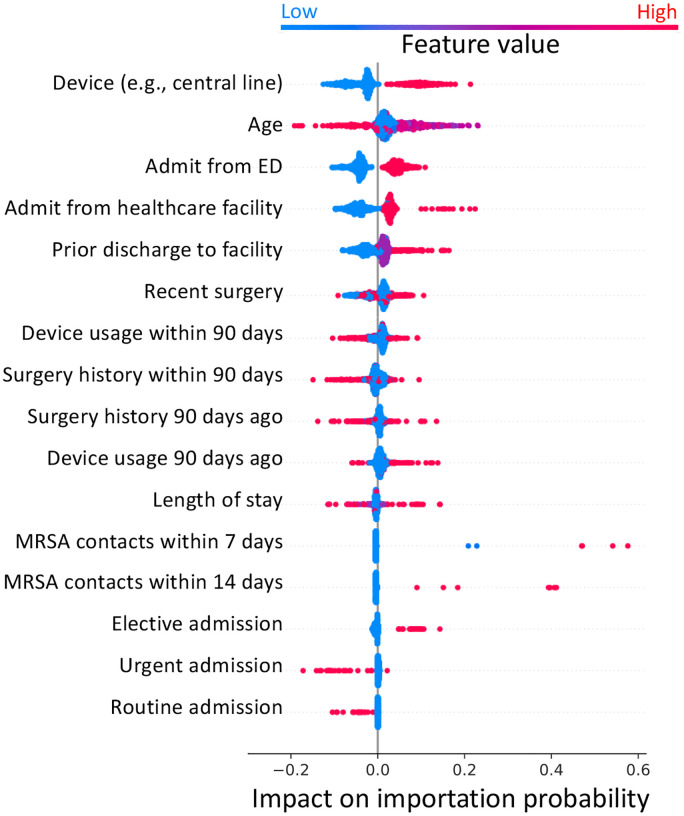
Healthcare-associated infections (HAIs) from multi-drug resistant organisms (MDROs) pose a significant challenge for healthcare systems. Patients can arrive at hospitals already infected ("importation") or acquire infections during their stay ("nosocomial infection"). Many cases, often asymptomatic, complicate rapid identification due to testing limitations and delays. Although recent advancements in mathematical modeling and machine learning have aimed to identify at-risk patients, these methods face challenges: transmission models often overlook valuable electronic health record (EHR) data, while machine learning approaches typically lack mechanistic insights into underlying processes. To address these issues, we propose NeurABM, a novel framework that integrates neural networks and agent-based models (ABM) to leverage the strengths of both methods. NeurABM simultaneously learns a neural network for patient-level importation predictions and an ABM for infection identification. Our findings show that NeurABM significantly outperforms existing methods, marking a breakthrough in accurately identifying importation cases and forecasting future nosocomial infections in clinical practice.


Conflict of interest statement

Competing Interests The authors declare no competing interests.

Figures

Figure 1:
Figure 1:. NeurABM framework.
a) Traditional machine learning and statistical methods use patients’ risk factors to predict the probability of being importation and/or future nosocomial infection cases. It is hard to explicitly incorporate epidemiological mechanisms. b) Modeling based methods are built on mechanistic models to capture the HAI spread in healthcare facilities. Here, observed cases are used to train an ABM to (1) learn underlying ABM parameters and (2) pin the ABM states to the spread dynamics until today, which allows people to run ABM simulations for T more days for forecasting. However, they cannot leverage the the risk factor of each patient from the EHR and have to make assumptions for future contact networks. c) To address this issue, we propose NeurABM framework to couple both neural networks and ABM simultaneously. Specifically, it is composed of two main components: the neural network component and the agent-based model (ABM) simulator component. The neural network component takes patient-specific risk factors data collected from EHR as input and outputs both the ABM parameters (applicable to every patient) and patient-specific parameters (importation probabilities in this paper). The ABM simulator component takes daily contact networks collected from EHR and the parameters as input, runs simulations for T days, and outputs the probability that each patient is in the Carriage state for each day. We then compare them with the ground-truth observations (via lab testing) and compute the first loss. To forecast future nosocomial infections, we start from predictions on day T and run simulations for T more days. Note that these T more days are for future, we assume that the contact networks will be the same as on day T, and use another adapter network to correct the potential bias caused by this assumption and get the final forecast. We also compute the loss of this forecast with ground-truth observations. With both losses, we backpropagate the total loss to adjust neural network parameters. This design allows us to train both the neural network and the ABM simultaneously in an end-to-end manner, mitigating the issues encountered when using either component individually.
Figure 2:
Figure 2:. The performance in identifying importation cases.
a) The precision-recall curves (PRC). The x-axis represents precision, and the y-axis represents recall. The red and other color curves represent NeurABM and other baselines. A larger area under the precision-recall curve (AUPRC) indicates better performance. AUPRC values are listed in the legends, and NeurABM has the highest AUPRC value. b) The negative predictive value (NPV) with different thresholds. The x-axis is the threshold for classification, and the y-axis is the NPV value. Circles, squares, and triangles correspond to the thresholds and NPV values where precision is 0.25, 0.5, and 0.75, respectively. A higher NPV value indicates fewer missing importation cases that are not identified and therefore better performance, and NeurABM has the highest NPV values. c) The receiver operating characteristic (ROC) curves in identifying MRSA importation cases. The x-axis is the false positive rate, and the y-axis is the true positive rate. A larger area under the ROC (AUC-ROC) indicates better performance. AUC-ROC values are listed in the legends, and NeurABM has the highest AUC-ROC value. d) The recall, F1 score, AUPRC, false positive rate, NPV, and AUC-ROC under different precisions (0.25, 0.5, 0.75). The best AUPRC and AUC-ROC are in bold.
Figure 3:
Figure 3:. The performance in identifying current nosocomial infection cases.
a) The precision-recall curves. The red and other color curves represent NeurABM and other baselines. Higher AUPRC is better, and NeurABM has the highest AUPRC value. b) The negative predictive value with different thresholds. Circles, squares, and triangles correspond to the thresholds and NPV values where precision is 0.25, 0.5, and 0.75, respectively. Higher NPV value is better, and NeurABM has the highest NPV values. c) The receiver operating characteristic curves in identifying MRSA nosocomial infection cases. Higher AUC-ROC is better, and NeurABM has the highest AUC-ROC value. d) The recall, F1 score, AUPRC, false positive rate, NPV, and AUC-ROC under different precisions. The best AUPRC and AUC-ROC are in bold.
Figure 4:
Figure 4:. The performance in forecasting future nosocomial infection cases.
a) The precision-recall curves. The red and other color curves represent NeurABM and other baselines. Higher AUPRC is better, and NeurABM has the highest AUPRC value. b) The negative predictive value with different thresholds. Circles, squares, and triangles correspond to the thresholds and NPV values where precision is 0.25, 0.5, and 0.75, respectively. Higher NPV value is better, and NeurABM has the highest NPV values. c) The receiver operating characteristic curves in forecasting future MRSA nosocomial infection cases. Higher AUC-ROC is better, and NeurABM has the highest AUC-ROC value. d) The recall, F1 score, AUPRC, false positive rate, NPV, and AUC-ROC under different precisions. The best AUPRC and AUC-ROC are in bold.
Figure 5:
Figure 5:. Percentage of identified MRSA cases by screening “high-risk” patients.
For each patient in the UVA ICUs, we use each method to estimate their MRSA infection probability and rank them according to this probability from high to low. We then screen different percentages of patients (x-axis) and see how many actual MRSA cases can be forecasted (y-axis). As seen in the figure, NeurABM can always identify more MRSA cases than other baselines.
Figure 6:
Figure 6:. The patient risk factors that are considered as having a high risk of being importation cases by the trained neural network.
Color of the dots represent risk factor values, with red indicating higher values. A higher impact means that NeurABM is more likely to consider the patient as an importation case.

Similar articles

References

    1. https://www.cdc.gov/healthcare-associated-infections/php/preventing-mdro....
    1. https://www.strobe-statement.org/download/strobe-checklist-cohort-studie....
    1. Adhikari B., Lewis B., Vullikanti A., Jimenez J. M., and Prakash B. A. Fast and near-optimal monitoring for healthcare acquired infection outbreaks. PLoS computational biology 15, 9 (2019), e1007284. - PMC - PubMed
    1. Albrich W. C., and Harbarth S. Health-care workers: source, vector, or victim of mrsa? The Lancet infectious diseases 8, 5 (2008), 289–301. - PubMed
    1. Bhalla A., Pultz N. J., Gries D. M., Ray A. J., Eckstein E. C., Aron D. C., and Donskey C. J. Acquisition of nosocomial pathogens on hands after contact with environmental surfaces near hospitalized patients. Infection Control & Hospital Epidemiology 25, 2 (2004), 164–167. - PubMed

Publication types

LinkOut - more resources