[Preprint]. 2024 Jul 16:2024.07.15.24310412.
doi: 10.1101/2024.07.15.24310412.

Spatial and temporal transmission dynamics of respiratory syncytial virus in New Zealand before and after the COVID-19 pandemic

Affiliations

Spatial and temporal transmission dynamics of respiratory syncytial virus in New Zealand before and after the COVID-19 pandemic

Lauren Jelley et al. medRxiv. .

Update in

Abstract

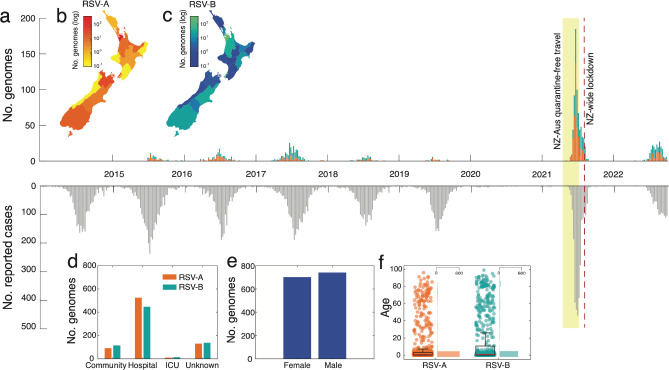
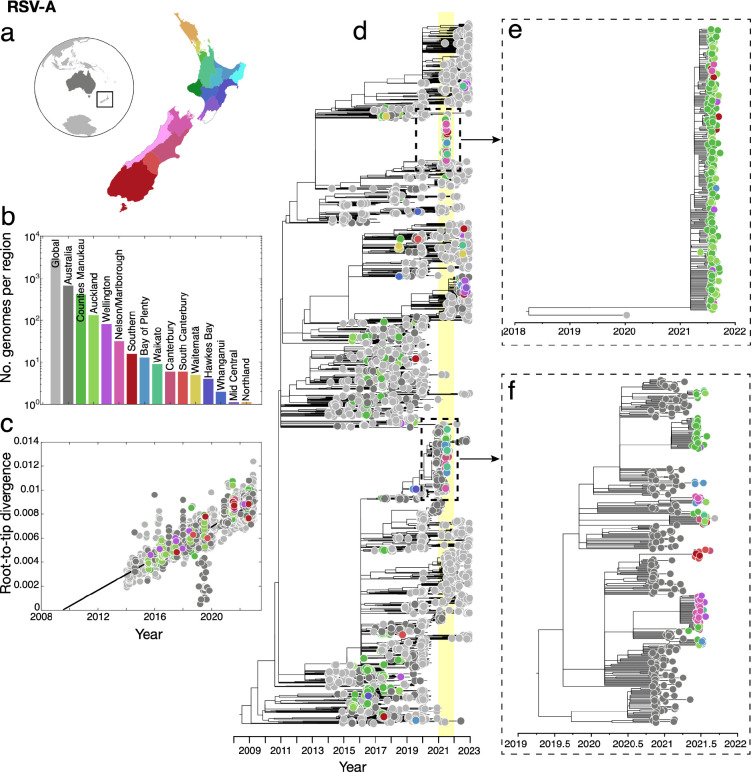
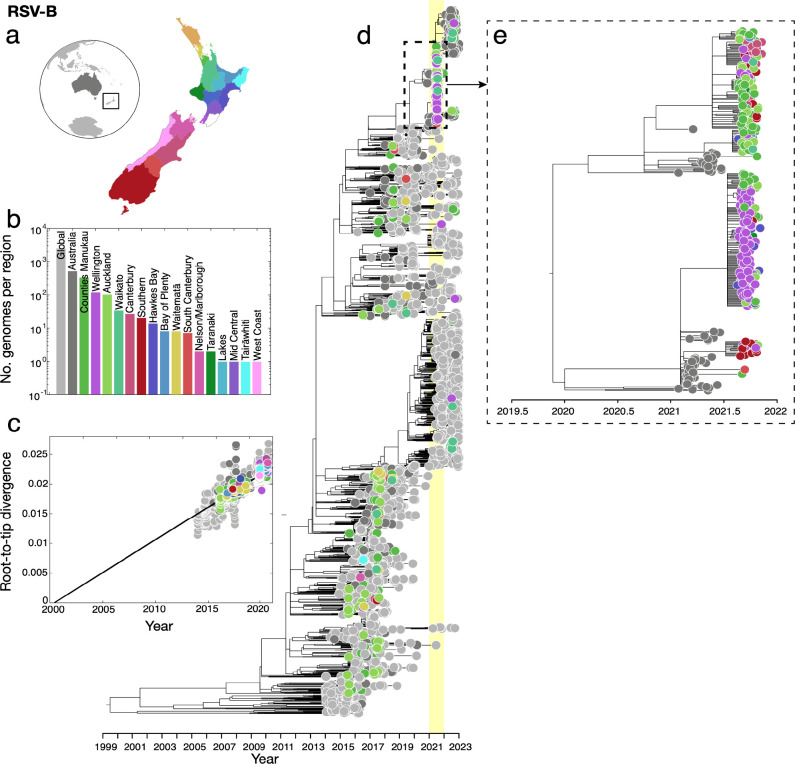
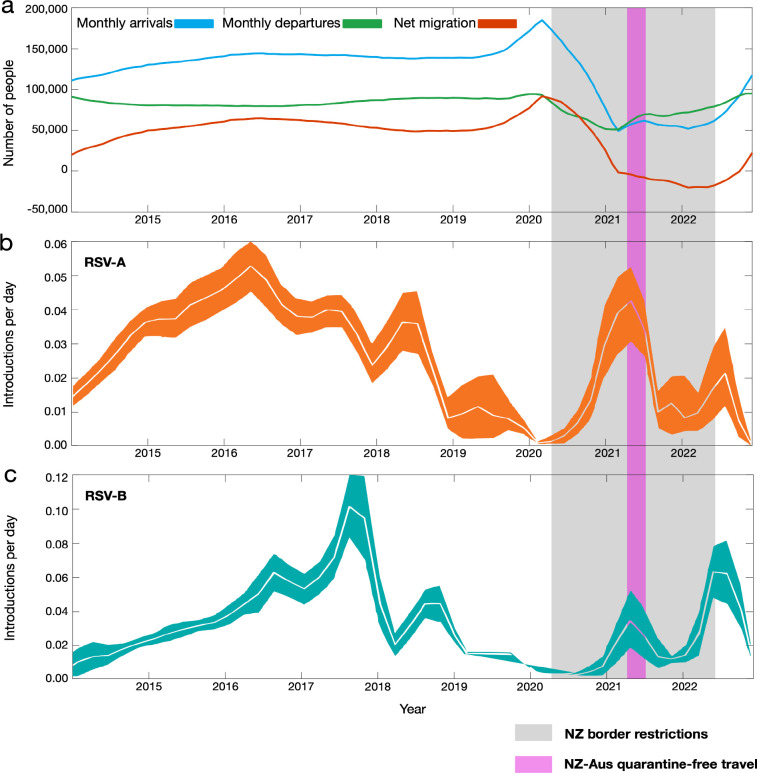
Human respiratory syncytial virus (RSV) is a major cause of acute respiratory infection. In 2020, RSV was effectively eliminated from the community in New Zealand due to non-pharmaceutical interventions (NPI) used to control the spread of COVID-19. However, in April 2021, following a brief quarantine-free travel agreement with Australia, there was a large-scale nationwide outbreak of RSV that led to reported cases more than five times higher, and hospitalisations more than three times higher, than the typical seasonal pattern. In this study, we generated 1,471 viral genomes of both RSV-A and RSV-B sampled between 2015 and 2022 from across New Zealand. Using a phylodynamics approach, we used these data to better understand RSV transmission patterns in New Zealand prior to 2020, and how RSV became re-established in the community following the relaxation of COVID-19 restrictions. We found that in 2021, there was a large epidemic of RSV in New Zealand that affected a broader age group range compared to the usual pattern of RSV infections. This epidemic was due to an increase in RSV importations, leading to several large genomic clusters of both RSV-A ON1 and RSV-B BA9 genotypes in New Zealand. However, while a number of importations were detected, there was also a major reduction in RSV genetic diversity compared to pre-pandemic seasonal outbreaks. These genomic clusters were temporally associated with the increase of migration in 2021 due to quarantine-free travel from Australia at the time. The closest genetic relatives to the New Zealand RSV genomes, when sampled, were viral genomes sampled in Australia during a large, off-season summer outbreak several months prior, rather than cryptic lineages that were sustained but not detected in New Zealand. These data reveal the impact of NPI used during the COVID-19 pandemic on other respiratory infections and highlight the important insights that can be gained from viral genomes.

Keywords: New Zealand; RSV; Respiratory syncytial virus; disease outbreak; genomic epidemiology; phylodynamics; virus evolution.


Figures

Figure 1.
Figure 1.
(a) Number of RSV-A (orange) and RSV-B (green) genomes generated over time based on sample collection date. The reflected grey bars below show the number of reported RSV positive cases in New Zealand over the same timeframe. (b-c) Map of New Zealand, coloured by the number of positive RSV-A and -B cases in each District Health Board. (d) The number of RSV genomes generated from cases reported in the community, hospital, intensive care unit (ICU), and those from unknown sources. (e) The number of RSV genomes generated from female and male patients. (f) The age distribution of patients from which RSV genomes were generated. A box plot indicates the mean (red), lower and upper quartiles (black), and the scatter points show the raw data. An adjacent vertical histogram shows the frequency of patient ages for RSV-A and RSV-B.
Figure 2.
Figure 2.
(a) Map of New Zealand (where regions are categorised by District Health Board (DHB)), Australia (dark grey), and the rest of the world (light grey). (b) Number of RSV-A genomes sampled per region, where colours correspond to those in (a). (c) Root-to-tip regression analysis of RSV-A genomes versus sampling time. (d) Maximum likelihood time-scaled phylogenetic tree showing 756 RSV-A genomes sampled from New Zealand (coloured circles based on DHB region), 662 RSV-A genomes sampled from Australia (dark grey) and 2,913 RSV-A genomes sampled from the rest of the world (light grey). A yellow vertical bar highlights the year 2021 and a dotted box shows the major New Zealand clades sampled. (e-f) Maximum likelihood time-scaled phylogenetic trees showing the major clades sampled in New Zealand during 2021 and their closest sampled genetic relatives.
Figure 3.
Figure 3.
(a) Map of New Zealand (where regions are categorised by District Health Board (DHB)), Australia (dark grey), and the rest of the world (light grey). (b) Number of RSV-B genomes sampled per region, where colours correspond to those in (a). (c) Root-to-tip regression analysis of RSV-B genomes versus sampling time. (d) Maximum likelihood time-scaled phylogenetic tree showing 715 RSV-B genomes sampled from New Zealand (coloured circles based on DHB region), 518 RSV-B genomes sampled from Australia (dark grey) and 2,577 RSV-B genomes sampled from the rest of the world (light grey). A yellow vertical bar highlights the year 2021 and a dotted box shows the major New Zealand clade sampled. (e) Maximum likelihood time-scaled phylogenetic tree showing the major clades sampled in New Zealand during 2021 and their closest sampled genetic relatives.
Figure 4.
Figure 4.
(a) Number of people arriving into New Zealand (blue), number of people departing New Zealand (green) and the overall net migration of people into New Zealand (red). (b-c) Estimated migration rates of RSV-A and-B into New Zealand over time (mean estimates are shown in white and 95% credible intervals are coloured). A grey shaded area shows the period in which New Zealand underwent border restrictions during the COVID-19 pandemic. A purple shaded area shows the quarantine-free travel period with Australia.

References

    1. Prasad N, Newbern EC, Trenholme AA, Thompson MG, Mcarthur C, Wong CA, et al. The health and economic burden of respiratory syncytial virus associated hospitalizations in adults. PLoS One. 2020; 15(6):e0234235. - PMC - PubMed
    1. Falsey AR, Hennessey PA, Formica MA, Cox C, Walsh EE. Respiratory syncytial virus infection in elderly and high-risk adults. New England Journal of Medicine. 2005; 352(17):1749–59. - PubMed
    1. Rima B, Collins P, Easton A, et al. ICTV virus taxonomy profile: Pneumoviridae. Journal of General Virology. 2017; 98(12):2912–2913. - PMC - PubMed
    1. Griffiths C, Drews SJ, Marchant DJ. Respiratory syncytial virus: infection, detection, and new options for prevention and treatment. Clinical Microbiology Reviews. 2017; 30(1):277–319. - PMC - PubMed
    1. Li Y, Wang X, Blau DM, et al. Global, regional, and national disease burden estimates of acute lower respiratory infections due to respiratory syncytial virus in children younger than 5 years in 2019: a systematic analysis. Lancet. 2022; 399(10340):2047–2064. - PMC - PubMed

Publication types

LinkOut - more resources