[Preprint]. 2024 Jul 15:2024.07.15.24310282.
doi: 10.1101/2024.07.15.24310282.

Multi-omics characterization of type 2 diabetes associated genetic variation

Affiliations

Multi-omics characterization of type 2 diabetes associated genetic variation

Ravi Mandla et al. medRxiv. .

Abstract

Discerning the mechanisms driving type 2 diabetes (T2D) pathophysiology from genome-wide association studies (GWAS) remains a challenge. To this end, we integrated omics information from 16 multi-tissue and multi-ancestry expression, protein, and metabolite quantitative trait loci (QTL) studies and 46 multi-ancestry GWAS for T2D-related traits with the largest, most ancestrally diverse T2D GWAS to date. Of the 1,289 T2D GWAS index variants, 716 (56%) demonstrated strong evidence of colocalization with a molecular or T2D-related trait, implicating 657 cis-effector genes, 1,691 distal-effector genes, 731 metabolites, and 43 T2D-related traits. We identified 773 of these cis- and distal-effector genes using either expression QTL data from understudied ancestry groups or inclusion of T2D index variants enriched in underrepresented populations, emphasizing the value of increasing population diversity in functional mapping. Linking these variants, genes, metabolites, and traits into a network, we elucidated mechanisms through which T2D-associated variation may impact disease risk. Finally, we showed that drugs targeting effector proteins were enriched in those approved to treat T2D, highlighting the potential of these results to prioritize drug targets for T2D. These results represent a leap in the molecular characterization of T2D-associated genetic variation and will aid in translating genetic findings into novel therapeutic strategies.


Conflict of interest statement

Disclosures J.B.M is an academic associate for Quest Diagnostics Inc. Endocrine R&D. MIMcC is now an employee of Genentech and a holder of Roche stock.

Figures

Figure 1:
Figure 1:. Overview of Project.
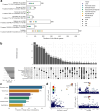
a) Genomic regions containing the 1,289 T2D-associated index variants from Suzuki et al. were tested for evidence of colocalization with 10 eQTL datasets, 4 pQTL datasets, 2 metabQTL datasets, and 46 related trait GWAS. Colocalizations were then mapped to an interactive network to visualize genes (from an eQTL or pQTL, colored green), metabolites (colored orange), or traits (colored purple) with evidence of sharing a causal variant with T2D around a index variant (colored yellow). These results were then used in downstream analyses to identify enrichment with expression datasets, better understand T2D pathways, and identify drug targets for T2D. b) Upset plot of the 716 T2D index variants mapped to an association in an eQTL, pQTL, metabQTL, or trait GWAS dataset (with a colocalization PP.H4 >0.8, Methods). c) Bar plot of the number of effector genes, metabolites, and traits identified from colocalization analyses with T2D.
Figure 2:
Figure 2:. Identification of putative effector genes for T2D.
a) Plotted are the number of effector genes for T2D previously identified from colocalization analyses between various T2D GWAS and eQTL datasets. Colors indicate the tissue type of the eQTL dataset and shape indicates major self-reported population group of the eQTL dataset. Gray bars represent the total number of unique transcripts across all colocalization analyses per GWAS. b) Upset plot of the variant to gene mappings identified in each eQTL dataset analyzed. c) Proportion of colocalizations with evidence in one tissue (PP.H4 >0.8) and no positive evidence observed in other tissues (PP.H4 <0.3). d) Example of a colocalization observed only in Pancreatic Islets, for the gene SCTR. Colors indicate LD in EUR populations from 1000G relative to rs2244214.
Figure 3:
Figure 3:. pQTL colocalizations identified in multiple datasets.
a) Upset plot of variant to gene mappings identified via colocalization analyses with four different pQTL datasets. b) Correlation of pQTL effect sizes for colocalizations identified in both UKB and deCODE pQTL datasets (Pearson R=0.93; P=9.1 × 10⁻¹⁷). c) Locus compare plot of CBLN4 using deCODE pQTL data. d) Colocalization subnetwork of rs1415287, containing the colocalizations with CBLN4 as well as a colocalization with IGFBP-1. Green nodes represent genes from an eQTL or pQTL, orange nodes represent metabolites, purple nodes represent traits, and yellow nodes represent T2D index variants. Size of the nodes indicate the number of colocalizations observed in the full network. Gray edges represent colocalizations with a plasma/blood dataset, green edges represent colocalizations with a subcutaneous adipose eQTL dataset, and pink edges represent colocalizations with a trait. Dashed lines indicate colocalizations are in the opposite direction as T2D risk and solid lines indicate colocalizations are in the same direction as T2D risk.
Figure 4:
Figure 4:. eQTL from understudied populations identify novel colocalizations with T2D.
a) Upset plot of colocalizations identified with blood eQTL datasets from four different populations. Orange bars represent colocalizations observed only in the Puerto Rican (PR), Mexican American (MX), or African American (AA) datasets (PP.H4 >0.8) and not in the European (EUR) dataset (PP.H4 <0.3). Blue bars represent colocalizations observed only in the EUR dataset (PP.H4 >0.8) and not in PR, MX, or AA datasets (PP.H4 <0.3). Gray bars represent colocalizations observed in any of the PR, MX, or AA datasets and showed a PP.H4 between 0.3 and 0.8 in the European dataset, or were observed in the European dataset but showed a PP.H4 between 0.3 and 0.8 in any of the PR, MX, or AA datasets. b) Log-fold change of allele frequencies between AMR-like and EUR-like populations for T2D index variants with a colocalization observed in one population group. c) Locus compare plots of LIN7A and ACSS3 with MX data. Colors indicate LD in AMR continental ancestry from 1000G relative to variant rs10128882. d) Allele frequencies of lead colocalizing variant rs10128882 (blue) and T2D index variant rs11114650 (black) per continental ancestry and per inferred local ancestry among AMR participants from gnomAD v4.0. e) Effect sizes of rs10128882 (blue) and rs11114650 (black) in both the T2D GWAS and blood eQTL datasets, stratified by ancestry.
Figure 5:
Figure 5:. Phosphatidylcholine has consistent negative effect directions with T2D risk.
a) Joint scatterplot of metabolites comparing the number of T2D-associated index variants they are mapped to compared to the change in T2D effect size per change in metabQTL effect size across the variants. Points are colored and sized by Benjamoni-Hochberg adjusted p-value. b) Increased glucose has consistent correlation with increased T2D risk at colocalizing index variants. c) Decreased phosphatidylcholine has consistent correlation with decreased T2D risk at index variants. d) Subnetwork of all colocalizations mapped to a Phosphatidylcholine-mapped T2D-associated index variant. Green nodes represent genes from an eQTL or pQTL, orange nodes represent metabolites, purple nodes represent traits, and yellow nodes represent T2D index variants. Size of the nodes indicate the number of colocalizations observed in the full network.
Figure 6:
Figure 6:. Type 2 Diabetes Clusters Match Trait Colocalizations.
a) left panel: Color indicates the percentage of total SNPs with a colocalization in each cluster; each row was a trait used for clustering. Final rows list total number of SNPs in each cluster and the total % of SNPs in the cluster with at least one colocalization. right panel: Color indicates the percentage of colocalizing SNPs who have the same (red) or opposite (blue) effect direction as the linked T2D SNP, with white indicating that SNPs are split 50/50 for direction, and gray indicating there were no colocalizations between that trait and any SNPs in that cluster. Text in each square indicates the total number of SNPs in that cluster that colocalize with that trait. b) Upset plot of all colocalizing SNPs with 2 or more trait group colocalizations showing trait group overlaps, with bars colored by cluster membership. c) Upset plot showing trait group overlaps for colocalizing SNPs in the lipodystrophy cluster, with gold bars highlighting overlaps that include 4 or more trait groups (n=19 out of 27 colocalizing SNPs).
Figure 7:
Figure 7:. Identification of novel drug targets for T2D.
a) Forest plot of chi2 enrichment results between drugs targeting colocalizing genes identified in at least one dataset (all), only from an eQTL, only from a pQTL, and only from a trans-pQTL with drugs having an approved indication of diabetes in Open Targets. b) Forest plot of enrichment results using drugs having an indication of diabetes. c) Locus compare plot of FXYD2, identified from a colocalization observed only with pancreatic islet eQTL data. d) Violin plot of FXYD2 expression per rs529623 genotype. e) Violin plot of FXYD2 expression among people with T2D and non-diabetes (ND) stratified by weight status in bulk pancreatic islet data. f) Violin plot of FXYD2 expression from human donor single-cell pancreatic islet data stratified by cell-type. Adjusted P-values <0.001 are indicated with “**”, and adjusted P-values <0.05 with “*”. Due to the low number of cells per sample, the differential expression test was not performed for some cell types (Methods).

References

    1. Herman W. H. & Zimmet P. Type 2 Diabetes: An Epidemic Requiring Global Attention and Urgent Action. Diabetes Care 35, 943–944 (2012). - PMC - PubMed
    1. Jaacks L. M., Siegel K. R., Gujral U. P. & Narayan K. M. V. Type 2 diabetes: A 21st century epidemic. Best Pract. Res. Clin. Endocrinol. Metab. 30, 331–343 (2016). - PubMed
    1. Rusina P. V. et al. Genetic support for FDA-approved drugs over the past decade. Nat. Rev. Drug Discov. 22, 864–864 (2023). - PubMed
    1. Minikel E. V., Painter J. L., Dong C. C. & Nelson M. R. Refining the impact of genetic evidence on clinical success. Nature 1–6 (2024) doi:10.1038/s41586-024-07316-0. - DOI - PMC - PubMed
    1. Duffy Á. et al. Development of a human genetics-guided priority score for 19,365 genes and 399 drug indications. Nat. Genet. 56, 51–59 (2024). - PMC - PubMed

Publication types

LinkOut - more resources