. 2024 Jul 12;9(29):31776-31788.
doi: 10.1021/acsomega.4c02858. eCollection 2024 Jul 23.

Managing Oxidative Stress Using Vitamin C to Improve Biocompatibility of Polycaprolactone for Bone Regeneration In Vitro

Affiliations

Managing Oxidative Stress Using Vitamin C to Improve Biocompatibility of Polycaprolactone for Bone Regeneration In Vitro

Elaf Akram Abdulhameed et al. ACS Omega. .

Abstract

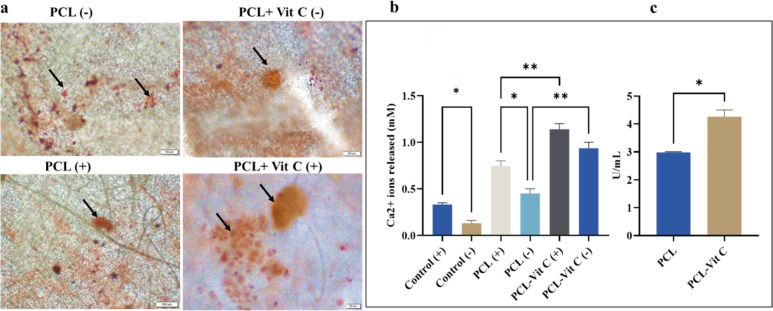
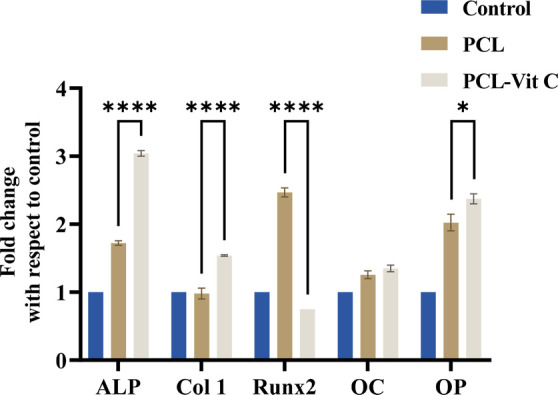
Increased oxidative stress in bone cells is known to negatively alter favorable bone regeneration. This study aimed to develop a porous polycaprolactone (PCL) membrane incorporated with 25 wt % Vitamin C (PCL-Vit C) and compared it to the PCL membrane to control oxidative stress and enhance biomineralization in vitro. Both membranes were characterized using SEM-EDS, FTIR spectroscopy, and surface hydrophilicity. Vitamin C release was quantified colorimetrically. Assessments of the viability and attachment of human fetal osteoblast (hFOB 1.19) cells were carried out using XTT assay, SEM, and confocal microscopy, respectively. ROS generation and wound healing percentage were measured using flow cytometry and ImageJ software, respectively. Mineralization study using Alizarin Red in the presence or absence of osteogenic media was carried out to measure the calcium content. Alkaline phosphatase assay and gene expression of osteogenic markers (alkaline phosphatase (ALP), collagen Type I (Col1), runt-related transcription factor 2 (RUNX2), osteocalcin (OCN), and osteopontin (OPN)) were analyzed by real-time PCR. SEM images revealed smooth, fine, bead-free fibers in both membranes. The FTIR spectrum of pure vitamin C was replaced with peaks at 3436.05 and 2322.83 cm-1 in the PCL-Vit C membrane. Vitamin C release was detected at 15 min and 1 h. The PCL-Vit C membrane was hydrophilic, generated lower ROS, and showed significantly higher viability than the PCL membrane. Although both PCL and PCL-Vit C membranes showed similar cellular and cytoskeletal morphology, more cell clusters were evident in the PCL-Vit C membrane. Lower ROS level in the PCL-Vit C membrane displayed improved cell functionality as evidenced by enhanced cellular differentiation with more intense alizarin staining and higher calcium content, supported by upregulation of osteogenic markers ALP, Col1, and OPN even in the absence of osteogenic supplements. The presence of Vitamin C in the PCL-Vit C membrane may have mitigated oxidative stress in hFOB 1.19 cells, resulting in enhanced biomineralization facilitating bone regeneration.


Conflict of interest statement

The authors declare no competing financial interest.

Figures

Figure 1
Figure 1
Morphology of PCL and PCL-Vit C membranes developed by electrospinning. SEM images revealed smooth, fine, bead-free structure in both PCL and PCL-Vit C membranes. SEM micrographs of (a) PCL membrane and (c) PCL-Vit C membranes showing irregularly shaped heterogeneous interconnected pores, with varying depth and wide size distribution. SEM micrographs of (b) PCL alone and (d) PCL-Vit C membranes showing varying fiber diameters. Bar graphs represent mean (e) pore size and (f) fiber diameter in PCL (n = 3) and PCL-Vit C membranes (n = 3). All data represent the mean ± SEM of three independent experiments. *p < 0.05; **p < 0.01 are indicated.
Figure 2
Figure 2
FTIR spectra of (a) pure PCL, (b) pure Vit C, and (c) PCL and PCL-Vit C membranes.
Figure 3
Figure 3
Contact angle images of a droplet of water on the surface of PCL and PCL-Vit C membranes. Representative images of contact angle measurements after exposing the surface of the (a) PCL and (b) PCL-Vit C membranes for 35 min are shown.
Figure 4
Figure 4
Cell attachment and spreading of hFOB 1.19 cells seeded onto the PCL and PCL-Vit C nanofibrous membranes. SEM analysis of hFOB 1.19 cells seeded on (a and b) PCL and (d and e) PCL-Vit C membranes. Cell attachment in (a and c) low magnification (scale bar = 300 μm) and (b and e) high magnification (scale bar = 50 μm) is shown. Confocal laser scanning micrographs of hFOB 1.19 cells seeded on (c) PCL and (f) PCL-Vit C nanofibrous membranes. Cells were stained with FITC-phalloidin (green) for F-actin cytoskeleton and DAPI for nucleus (blue). Cell clusters were more evident in PCL-Vit C membrane. Scale bar = 100 μm. (g) Mean fluorescence intensity (MFI) of hFOB 1.19 cells following adherence and spreading on PCL and PCL- Vit C membranes. * p < 0.05 is indicated.
Figure 5
Figure 5
Cell viability by XTT assay after 24, 48 and 72 h of direct and indirect (extraction) culture of hFOB 1.19 cells on (a) PCL and (b) PCL-Vit C membranes. Bar graphs represent mean ± SEM percentage viability of cells. All data represent the mean ± SEM of three independent experiments. *p < 0.05 and **p < 0.01 are indicated.
Figure 6
Figure 6
Flow cytometry analysis of ROS release in hFOB 1.19 cells grown on PCL and PCL-Vit C membranes at days 1, 2, and 7 in culture. (a) Representative flow cytometry histograms showing Alexa fluorophore 488 positive (right peak, ROS positive) and negative cells (left peak, ROS negative). (b) The histogram represents the mean fluorescent intensity (MFI) at indicated time points. All data represent the mean ± SEM of three independent experiments. ***p < 0.001, ****p < 0.0001 are indicated.
Figure 7
Figure 7
Wound healing assay. Representative images of wound scratch assay of hFOB 1.19 cells grown in (a) control 2.5% FBS containing culture medium, (b) extracts from PCL and (c) PCL-Vit C membranes at 24 h of culture. (d) Percentage (%) wound gap in the hFOB 1.19 cells treated with control 2.5% FBS containing culture medium, extracts from PCL, and PCL-Vit C membranes at 0, 6, and 24 h. All data represent the mean ± SEM of three independent experiments.
Figure 8
Figure 8
Extracellular matrix mineralization in hFOB cells grown in PCL and PCL-Vit-C membranes (a) Microscopic images showing calcification nodules (arrows) at day 14 in the presence (+) and absence (−) of osteogenesis supplements. Scale bar = 100 μm for all panels. (b) Quantification of alizarin Red S-stained mineralized nodules showing calcium release at day 14 in culture. (c) Quantification of alkaline phosphatase activity (ALP U/mL) at day 14 in culture. All data represent the mean ± SEM of three independent experiments. *p < 0.05, **p < 0.01 are indicated.
Figure 9
Figure 9
Realtime PCR analysis for expression of osteogenic markers in hFOB cells grown on PCL and PCL-Vit C membranes for 14 days. Histograms representing the relative changes (fold change) in the levels of expression of alkaline phosphatase (ALP), collagen type 1 (Col 1), Runt-related transcription factor 2 (Runx2), osteocalcin (OC), and osteopontin (OP) in hFOB cells. All results represent the mean ± SEM of three independent experiments. *p < 0.05 and ****p < 0.001 are indicated.

References

    1. Williams D. F. On the mechanisms of biocompatibility. Biomaterials 2008, 29 (20), 2941–2953. 10.1016/j.biomaterials.2008.04.023. - DOI - PubMed
    1. Roddy E.; DeBaun M. R.; Daoud-Gray A.; Yang Y. P.; Gardner M. J. Treatment of critical-sized bone defects: clinical and tissue engineering perspectives. European Journal of Orthopaedic Surgery & Traumatology 2018, 28, 351–362. 10.1007/s00590-017-2063-0. - DOI - PubMed
    1. Mouthuy P.-A.; Snelling S. J.; Dakin S. G.; Milković L.; Gašparović A. Č.; Carr A. J.; Žarković N. Biocompatibility of implantable materials: an oxidative stress viewpoint. Biomaterials 2016, 109, 55–68. 10.1016/j.biomaterials.2016.09.010. - DOI - PubMed
    1. Chang H.-H.; Guo M.-K.; Kasten F. H.; Chang M.-C.; Huang G.-F.; Wang Y.-L.; Wang R.-S.; Jeng J.-H. Stimulation of glutathione depletion, ROS production and cell cycle arrest of dental pulp cells and gingival epithelial cells by HEMA. Biomaterials 2005, 26 (7), 745–753. 10.1016/j.biomaterials.2004.03.021. - DOI - PubMed
    1. Lin T.-h.; Tamaki Y.; Pajarinen J.; Waters H. A.; Woo D. K.; Yao Z.; Goodman S. B. Chronic inflammation in biomaterial-induced periprosthetic osteolysis: NF-κB as a therapeutic target. Acta biomaterialia 2014, 10 (1), 1–10. 10.1016/j.actbio.2013.09.034. - DOI - PMC - PubMed

LinkOut - more resources