. 2024 Jul 4:36:508-523.
doi: 10.1016/j.bioactmat.2024.06.035. eCollection 2024 Jun.

Macrophage-derived extracellular vesicles regulate skeletal stem/progenitor Cell lineage fate and bone deterioration in obesity

Affiliations

Macrophage-derived extracellular vesicles regulate skeletal stem/progenitor Cell lineage fate and bone deterioration in obesity

Chen He et al. Bioact Mater. .

Abstract

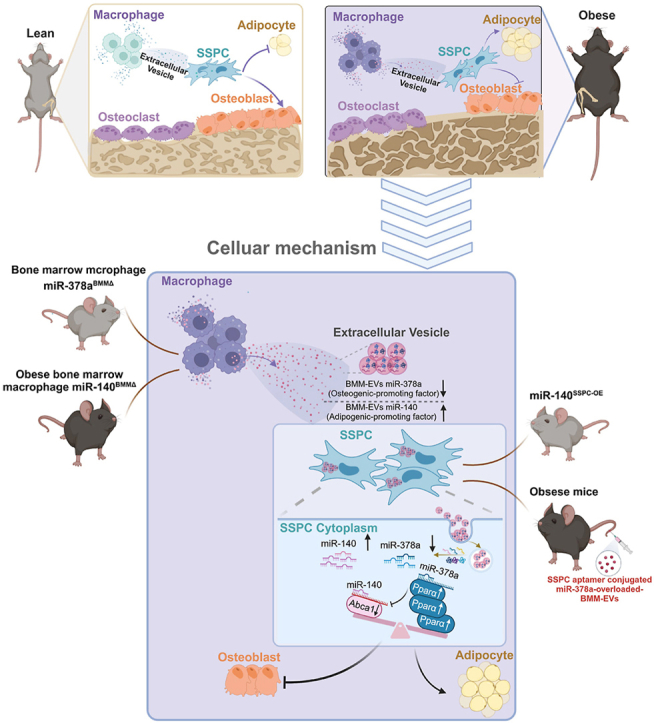
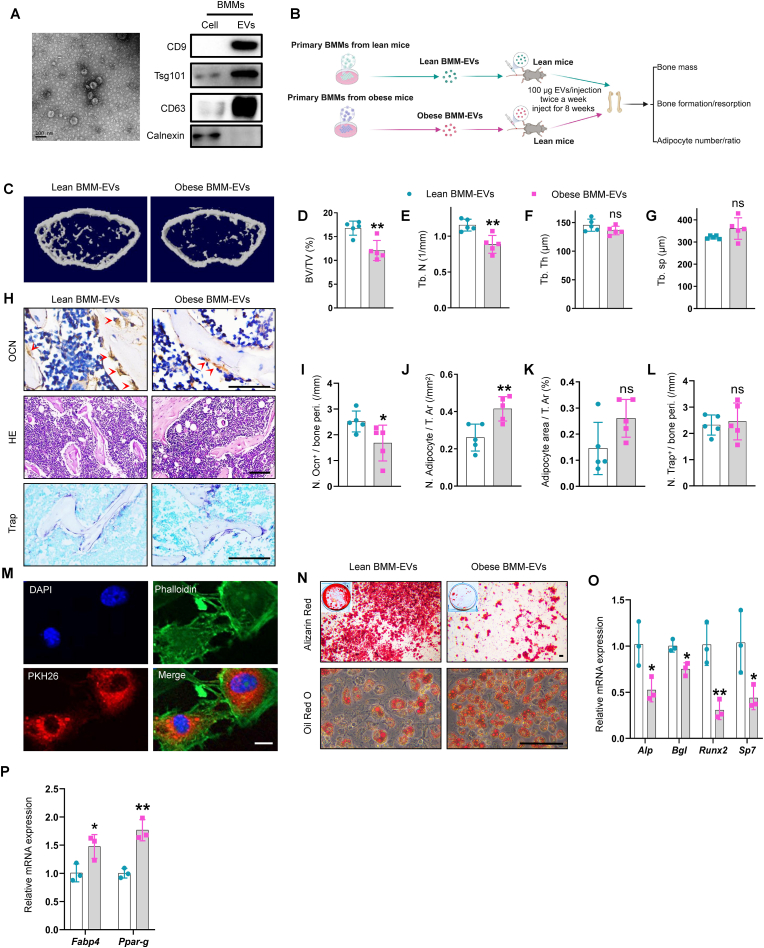
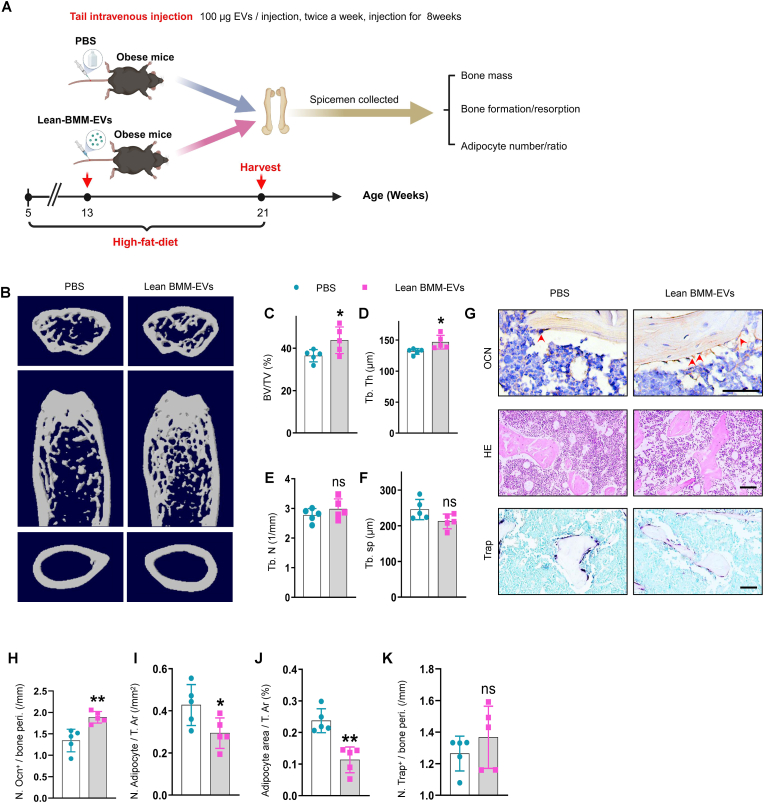
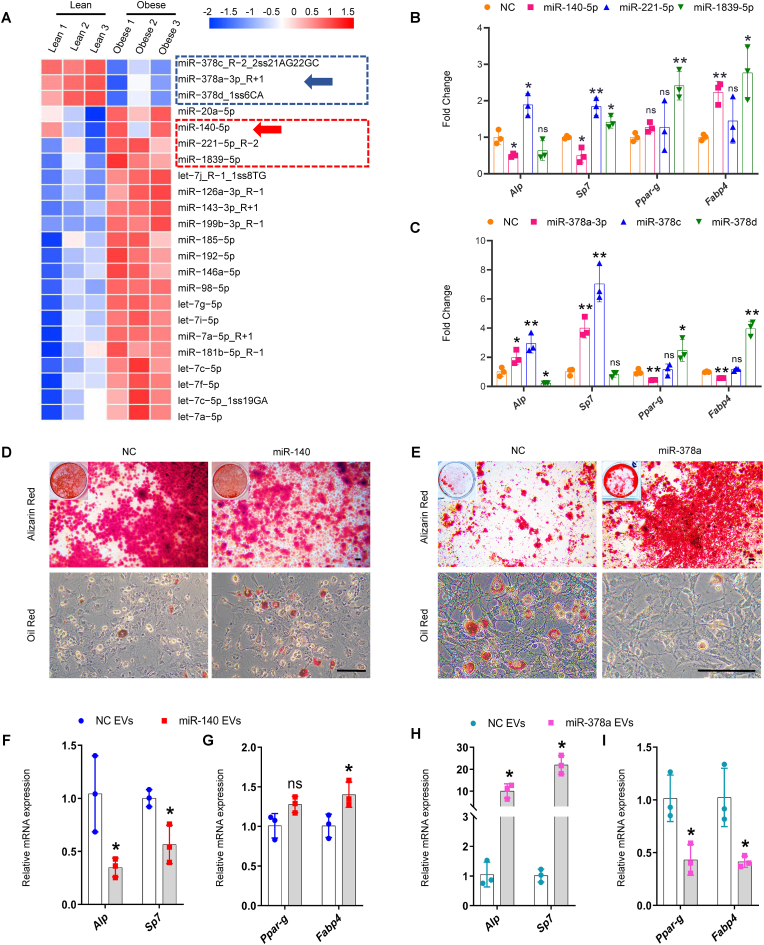
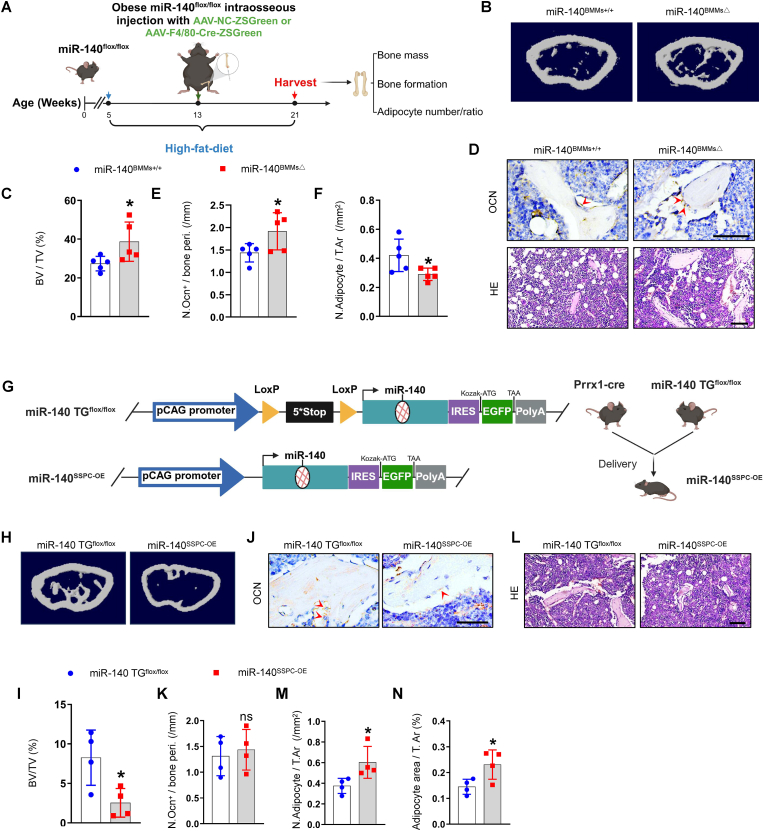
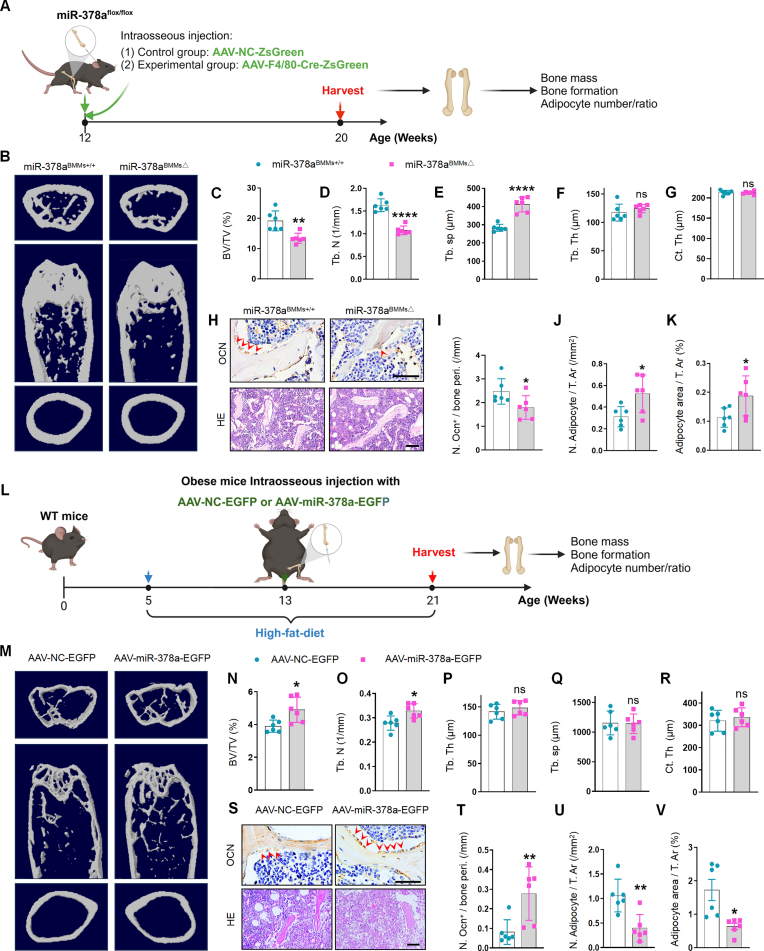
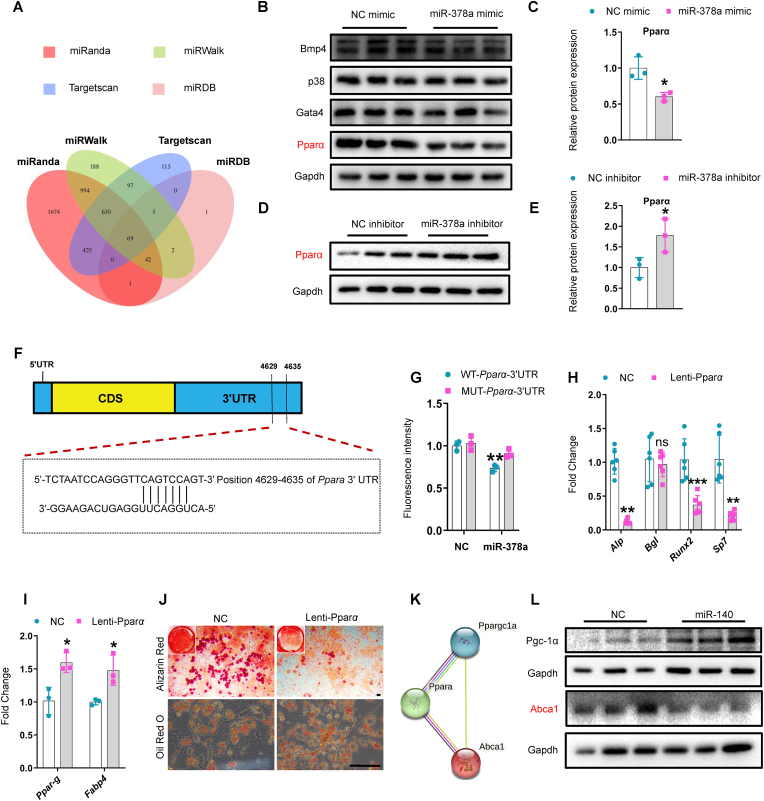
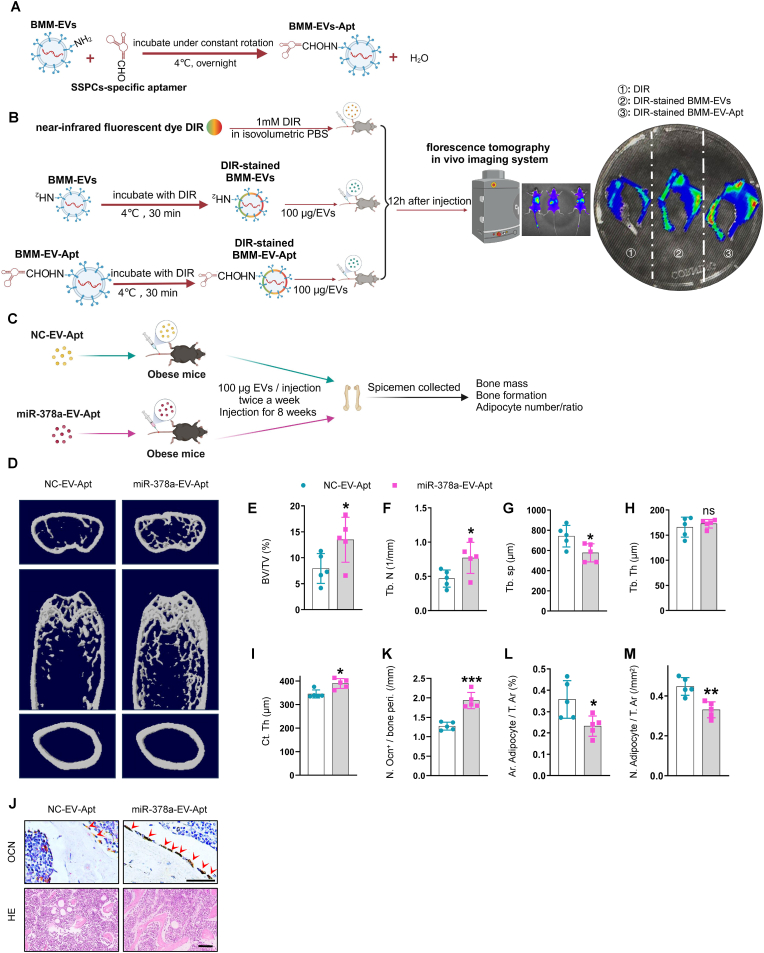
Obesity-induced chronic inflammation exacerbates multiple types of tissue/organ deterioration and stem cell dysfunction; however, the effects on skeletal tissue and the underlying mechanisms are still unclear. Here, we show that obesity triggers changes in the microRNA profile of macrophage-secreted extracellular vesicles, leading to a switch in skeletal stem/progenitor cell (SSPC) differentiation between osteoblasts and adipocytes and bone deterioration. Bone marrow macrophage (BMM)-secreted extracellular vesicles (BMM-EVs) from obese mice induced bone deterioration (decreased bone volume, bone microstructural deterioration, and increased adipocyte numbers) when administered to lean mice. Conversely, BMM-EVs from lean mice rejuvenated bone deterioration in obese recipients. We further screened the differentially expressed microRNAs in obese BMM-EVs and found that among the candidates, miR-140 (with the function of promoting adipogenesis) and miR-378a (with the function of enhancing osteogenesis) coordinately determine SSPC fate of osteogenic and adipogenic differentiation by targeting the Pparα-Abca1 axis. BMM miR-140 conditional knockout mice showed resistance to obesity-induced bone deterioration, while miR-140 overexpression in SSPCs led to low bone mass and marrow adiposity in lean mice. BMM miR-378a conditional depletion in mice led to obesity-like bone deterioration. More importantly, we used an SSPC-specific targeting aptamer to precisely deliver miR-378a-3p-overloaded BMM-EVs to SSPCs via an aptamer-engineered extracellular vesicle delivery system, and this approach rescued bone deterioration in obese mice. Thus, our study reveals the critical role of BMMs in mediating obesity-induced bone deterioration by transporting selective extracellular-vesicle microRNAs into SSPCs and controlling SSPC fate.

Keywords: Aptamer; Cell fate; Cell-specific targeting; Macrophage-derived extracellular vesicles; Obesity-induced bone deterioration; Skeletal stem/progenitor cells.


Conflict of interest statement

The authors declare no conflict of interests.

Figures

Image 1
Graphical abstract
Fig. 1
Fig. 1
Bone marrow macrophage-derived extracellular vesicles from obese mice induce bone deterioration in lean mice. (A) Representative picture of BMM-EVs (left), scale bar: 100 nm; representative western blotting images of CD9, Tsg101, CD63, and Calnexin in cell lysis of bone marrow macrophage and BMM-EVs (right). (B) Schematic diagram of lean mice with lean/obese BMM-EVs intervention. (C) Representative μCT images of lean mice with lean/obese BMM-EVs intervention. n = 5 per group. (D–G) Quantitative μCT analysis of BV/TV, Tb. N, Tb. Th, and Tb. Sp from lean mice with lean/obese BMM-EV intervention. n = 5 per group. (H) Representative images of osteocalcin immunohistochemical staining (H, top). Red arrows mark osteoblasts. Scale bar: 50 μm; representative images of H&E staining (H, middle), and Trap staining (H, bottom) in distal femora. Scale bar: 100 μm. (I–K) Quantification of the number of osteocalcin-positive osteoblasts (I) and number and area of adipocytes (J–K). (L) Quantification of osteoclast number in distal femora from lean mice with lean/obese BMM-EV intervention. (M) BMM-EVs were taken up by SSPCs. Red fluorescence represents PKH26 marked extracellular vesicles; green fluorescence represents phalloidin labeled cytoskeleton, and blue fluorescence indicates nuclei. Scale bar: 2.5 μm. (N) Representative images of Alizarin red staining of lean BMM-EV and obese BMM-EV-treated SSPCs (N, top); representative images of oil red O staining of lean BMM-EV and obese BMM-EV-treated SSPCs (N, bottom). n = 3 per group. Scale bar: 100 μm. (O–P) qRT-PCR analysis of the relative expression levels of osteogenic genes (O) and adipogenic genes (P) in lean BMM-EV and obese BMM-EV-treated SSPCs cultured in osteogenesis and/or adipogenesis induction medium. Data is shown as mean ± SD. *P < 0.05, **P < 0.01, ns, no significant. (Welch's test is used in Fig. 1G, and student t-test is used in others).
Fig. 2
Fig. 2
Lean BMM-EVs ameliorate bone deterioration and marrow fat accumulation in obese mice. 5-week-old C57BL/6J male mice were fed with a high-fat diet for 2 months, then treated these obese recipient mice with lean BMM-EVs for 2 months (100 μg, twice a week) and collected distal femora for further study. (A) Schematic diagram of obese mice with PBS and lean BMM-EV intervention. (B-F) Representative μCT images (B) and quantitative μCT analysis of trabecular bone (C-F) from obese mice with PBS and/or lean BMM-EV intervention. n = 5 per group. (G) Representative images of osteocalcin immunohistochemical staining (G, top). Red arrows mark osteoblasts. Scale bar: 50 μm; representative images of H&E staining (G, middle) and Trap staining (G, bottom) in distal femora. Scale bar: 100 μm. (H-K) Quantification of the number of osteoblasts (H); number and area of adipocytes (I-J) and number of Trap-positive osteoclasts (K). Data is shown as mean ± SD. *P < 0.05, **P < 0.01, ns, no significant. (Student t-test).
Fig. 3
Fig. 3
BMM-EV miR-378a-3p and miR-140-5p may coordinately regulate SSPC lineage fate. (A) miRNA microarray analyzes the differently expressed microRNAs in lean BMM-EVs and obese BMM-EVs. The red rectangle circles three up-regulated microRNAs in obese BMM-EVs, and the blue rectangle circles three down-regulated microRNAs. The arrows mark the microRNAs chosen for further functional verification. n = 3 per group. (B) qRT-PCR analysis of the relative expression levels of osteogenic genes (Alp, Sp7) and adipogenic genes (Ppar-g, Fabp4) of the SSPCs transfected with three up-regulated microRNAs (miR-140-5p, miR-221-5p, and miR-1839-5p) and their negative controls, which culture in osteogenic and adipogenic medium for 6 days, respectively. NC, negative control. n = 3 per group. (C) qRT-PCR analysis of the relative expression levels of osteogenic genes (Alp, Sp7) and adipogenic genes (Ppar-g, Fabp4) of the SSPCs transfected with three downregulated microRNAs (miR-378a-3p, miR-378c, and miR-378d) and their negative controls for 6 days, respectively. n = 3 per group. (D) Representative images of Alizarin red staining (D, top) and oil red O staining (D, bottom) of the SSPCs transfected with miR-140 and negative controls. Scale bar: 100 μm. (E) Representative images of Alizarin red staining (E, top) and oil red O staining (E, bottom) of the SSPCs transfected with miR-378a and negative controls. Scale bar: 100 μm. (F-I) BMM-EVs overloaded with miR-140 and miR-378a regulate SSPC lineage fate between osteoblasts and adipocytes. qRT-PCR analysis of the relative expression levels of osteogenic genes (F and H) and adipogenic genes (G and I) in miRNA-140 enriched macrophage-derived extracellular vesicle and miR-378a enriched macrophage-derived extracellular vesicle-treated SSPCs. n = 3 per group. Data is shown as mean ± SD. *P < 0.05, **P < 0.01, ns, no significant. (Welch's test is used in the Fabp4 expression of Fig. 3B, Ppar-g and Fabp4 expression of Fig. 3C, and Alp, Sp7 expression in Fig. 3H, non-parametric test is used in Sp7 expression of Fig. 3C and student t-test is used in others).
Fig. 4
Fig. 4
Conditional miR-140 knockout and conditional miR-140 over-expression regulate bone deterioration and SSPC cell fate in vivo. (A-F) Adeno-associated-virus-F4/80-cre-ZsGreen (AAV-F4/80-Cre-ZsGreen) and adeno-associated-virus-NC-ZsGreen (AAV-NC-ZsGreen) were injected into intra bone marrow of obese miRNA-140flox/flox littermate to generate BMM conditional miRNA-140 knockout mice and negative controls. Two months after injection, femur specimens were collected. n = 5 per group. (A) Timeline diagram of obese BMM conditional miRNA-140 knockout mice generation. (B–C) Representative μCT images (B) and quantitative μCT analysis (C) of trabecular bone. (D) Representative images of osteocalcin staining (D, top). Red arrows mark osteoblasts. Scale bar: 50 μm; representative images of H&E staining (D, bottom). Scale bar: 100 μm; (E-F) Quantification of the number of osteoblasts (E) and number of adipocytes (F). (G–N) Cross miRNA-140TGflox/flox mice with Prrx1-cre mice to generate SSPC conditional miR-140 over-expression mice (miRNA-140SSPC-OE). (G) Diagram of miR-140TGflox/flox mice construct and miRNA-140SSPC-OE mice generation. An exogenous donor sequence containing terminators and miR-140 was inserted into chromosome 11 in wild-type mice. Loxp sites are depicted by yellow arrows, miR-140SSPC-OE represents Prrx1-cre; miR-140TGflox/+ mice. (H-I) Representative μCT images (H) and quantitative μCT analysis of trabecular bone (I) from miRNA-140SSPC-OE and miRNA-140 TGflox/flox mice. n = 4 per group. (J–K) Representative images of osteocalcin staining (J) and quantification of number of osteoblasts (K). n = 4 per group. Red arrows mark osteoblasts. Scale bar: 50 μm. (L-N) Representative images of H&E staining (L) and number and area of adipocytes (M-N). Scale bar: 100 μm. Data is shown as mean ± SD. *P < 0.05, **P < 0.05, ns, no significant. (Student t-test).
Fig. 5
Fig. 5
Conditional miR-378a knockout and miR-378a over-expression modulate bone mass and marrow fat accumulation. (A-K) AAV-F4/80-Cre-ZsGreen and AAV-NC-ZsGreen were injected into the bone cavity of miRNA-378aflox/flox littermate to generate BMM conditional miRNA-378a knockout mice (miRNA-378aBMMs△) and their controls. 2 months after injection, the mice are sacrificed. n = 6 per group. (A) Timeline diagram of BMM conditional miR-378a knockout mice generation. (B-G) Representative μCT images (B) and quantitative μCT analysis of trabecular (C-F) and cortical bone (G) from lean miR-378aBMMs△ and miRNA-378aBMMs+/+ mice. (H) Representative images of osteocalcin staining (H, top). Red arrows mark osteoblasts. Scale bar: 50 μm; representative images of H&E staining (H, bottom). Scale bar: 100 μm. (I-K) Quantification of number of osteoblasts (I) and number and area of adipocytes (J-K). (L-V) Adeno-associated-virus-miR-378a-EGFP (AAV-miR-378a-EGFP) and adeno-associated-virus-NC-GFP (AAV-NC-EGFP) were injected into the bone cavity in obese mice with the same age and gender. 2 months after injection, the mice are sacrificed. (L) Timeline diagram of miR-378a-overexpressing mice generation. (M) Representative μCT images of AAV-miR-378a-EGFP and AAV-NC-EGFP treated mice. n = 6 per group. (N-Q) Quantitative μCT analysis of trabecular bone. (R) Quantitative μCT analysis of cortical bone. (S) Representative images of osteocalcin staining (S, top). Red arrows mark osteoblasts. Scale bar: 50 μm; representative images of H&E staining (S, bottom). Scale bar: 100 μm. (T-V) Quantification of the number of osteoblasts (T) and number and area of adipocytes (U-V) in distal femora. Data is shown as mean ± SD. *P < 0.05, **P < 0.01, ****P < 0.0001, ns, no significant. (Non-parametric test is used in Fig. 5 I and Fig. 5 T, Welch's test is used in Fig. 5 V, student t-test is used in others).
Fig. 6
Fig. 6
miR-378a and miR-140 synergistically regulated SSPC lineage fate via targeting the Pparα-Abca1 axis. (A) Venn diagram of the miR-378a target gene. (B-C) Representative western blotting images of Bmp4, p38, Gata 4, Pparα, and Gapdh (B); quantification of Pparα expression (C) in SSPCs transfected with the mimic of miR-378a and its negative controls for 3 days. n = 3 per group. (D-E) Representative western blotting images of Pparα (D) and quantification of Pparα expression (E) in SSPCs transfected with the inhibitor of miR-378a and its negative controls for 3 days. n = 3 per group. (F) Schematic of miR-378a putative target sites in mouse Pparα 3′-UTR. CDS, coding sequence. (G) SSPCs were transfected with luciferase reporter carrying WT or MUT 3′-UTR of the Pparα gene (WT-Pparα-Fluc and/or Mut-Pparα-Fluc) and co-transfected with miR-NC and/or miR-378a, respectively. Fluorescence intensity was determined at 48 h after transfection; the asterisk means WT-Pparα-3′-UTR co-transfected with miR-NC vs. WT-Pparα-3′-UTR co-transfected with miR-378a (H-I) SSPCs were transfected with lenti-Pparα to induce osteogenesis and/or adipogenesis for 6 days. qRT-PCR analysis of the relative expression levels of osteogenic genes (H), n = 6 per group, and adipogenic genes (I), n = 3 per group. (J) Representative images of Alizarin red staining (J, top) and oil red O staining (J, bottom). Scale bar: 100 μm, n = 3 per group. (K) Schematic of protein interaction diagram of Pparα, Abca1, and Pgc-1α. (L) Representative western blotting images of Abca1 and Pgc-1 in SSPCs transfected with miR-140 and its negative controls. n = 3 per group. Data is shown as mean ± SD. *P < 0.05, **P < 0.01, ***P < 0.001, ns, no significant. (Non-parametric test is used in Alp expression of Fig. 6H, Welch's test is used in Sp7 expression of Fig. 6H, and student t-test is used in others).
Fig. 7
Fig. 7
SSPC-aptamer conjugated miR-378a-overloaded-EVs alleviated bone loss in obese mice. (A) Schematic of SSPC-aptamer conjugated BMM-EVs generation. (B) Representative fluorescence molecular tomography (FMT) images of near-infrared fluorescence signals in lower limbs isolated from mice administered with DIR dye alone, DIR-stained BMM-EV, and DIR-stained aptamer-conjugated BMM-EVs (BMM-EV-apt). (C) Schematic of SSPC-aptamer conjugated miR-378a-BMM-EV generation. (D-I) Representative μCT images (D) and quantitative μCT analysis of trabecular (E-H) and cortical bone (I) from obese mice with NC-EV-Apt and/or miR-378a-EV-Apt intervention. (J) Representative images of osteocalcin staining (J, top). Red arrows mark osteoblasts. Scale bar: 50 μm; representative images of H&E staining (J, bottom). Scale bar: 100 μm (K–M) Quantification of number of osteoblasts (K) and number and area of adipocytes (L–M). Data is shown as mean ± SD. *P < 0.05, **P < 0.01, ***P < 0.001, ns, no significant. (Non-parametric test is used in Fig. 7 I, and student t-test is used in others).

References

    1. Hata M., Andriessen E., Hata M., Diaz-Marin R., Fournier F., Crespo-Garcia S., Blot G., Juneau R., Pilon F., Dejda A., Guber V., Heckel E., Daneault C., Calderon V., Des Rosiers C., Melichar H.J., Langmann T., Joyal J.S., Wilson A.M., Sapieha P. Past history of obesity triggers persistent epigenetic changes in innate immunity and exacerbates neuroinflammation. Science. 2023;379(6627):45–62. doi: 10.1126/science.abj8894. - DOI - PubMed
    1. Bapat S.P., Whitty C., Mowery C.T., Liang Y., Yoo A., Jiang Z., Peters M.C., Zhang L.J., Vogel I., Zhou C., Nguyen V.Q., Li Z., Chang C., Zhu W.S., Hastie A.T., He H., Ren X., Qiu W., Gayer S.G., Liu C., Choi E.J., Fassett M., Cohen J.N., Sturgill J.L., Crotty Alexander L.E., Suh J.M., Liddle C., Atkins A.R., Yu R.T., Downes M., Liu S., Nikolajczyk B.S., Lee I.K., Guttman-Yassky E., Ansel K.M., Woodruff P.G., Fahy J.V., Sheppard D., Gallo R.L., Ye C.J., Evans R.M., Zheng Y., Marson A. Obesity alters pathology and treatment response in inflammatory disease. Nature. 2022;604(7905):337–342. doi: 10.1038/s41586-022-04536-0. - DOI - PMC - PubMed
    1. Li Q., Hagberg C.E., Silva Cascales H., Lang S., Hyvonen M.T., Salehzadeh F., Chen P., Alexandersson I., Terezaki E., Harms M.J., Kutschke M., Arifen N., Kramer N., Aouadi M., Knibbe C., Boucher J., Thorell A., Spalding K.L. Obesity and hyperinsulinemia drive adipocytes to activate a cell cycle program and senesce. Nat Med. 2021;27(11):1941–1953. doi: 10.1038/s41591-021-01501-8. - DOI - PubMed
    1. Cardoso F., Klein Wolterink R.G.J., Godinho-Silva C., Domingues R.G., Ribeiro H., da Silva J.A., Mahu I., Domingos A.I., Veiga-Fernandes H. Neuro-mesenchymal units control ILC2 and obesity via a brain-adipose circuit. Nature. 2021;597(7876):410–414. doi: 10.1038/s41586-021-03830-7. - DOI - PMC - PubMed
    1. Zhang P., Peterson M., Su G.L., Wang S.C. Visceral adiposity is negatively associated with bone density and muscle attenuation. Am. J. Clin. Nutr. 2015;101(2):337–343. doi: 10.3945/ajcn.113.081778. - DOI - PMC - PubMed

LinkOut - more resources