. 2024 Sep 15;213(6):865-875.
doi: 10.4049/jimmunol.2400041.

Renal IL-23-Dependent Type 3 Innate Lymphoid Cells Link Crystal-induced Intrarenal Inflammasome Activation with Kidney Fibrosis

Affiliations

Renal IL-23-Dependent Type 3 Innate Lymphoid Cells Link Crystal-induced Intrarenal Inflammasome Activation with Kidney Fibrosis

Teresa M Frasconi et al. J Immunol. .

Abstract

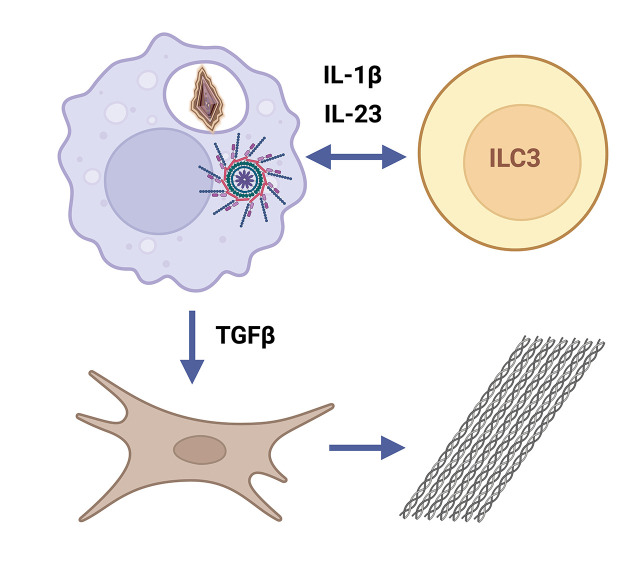
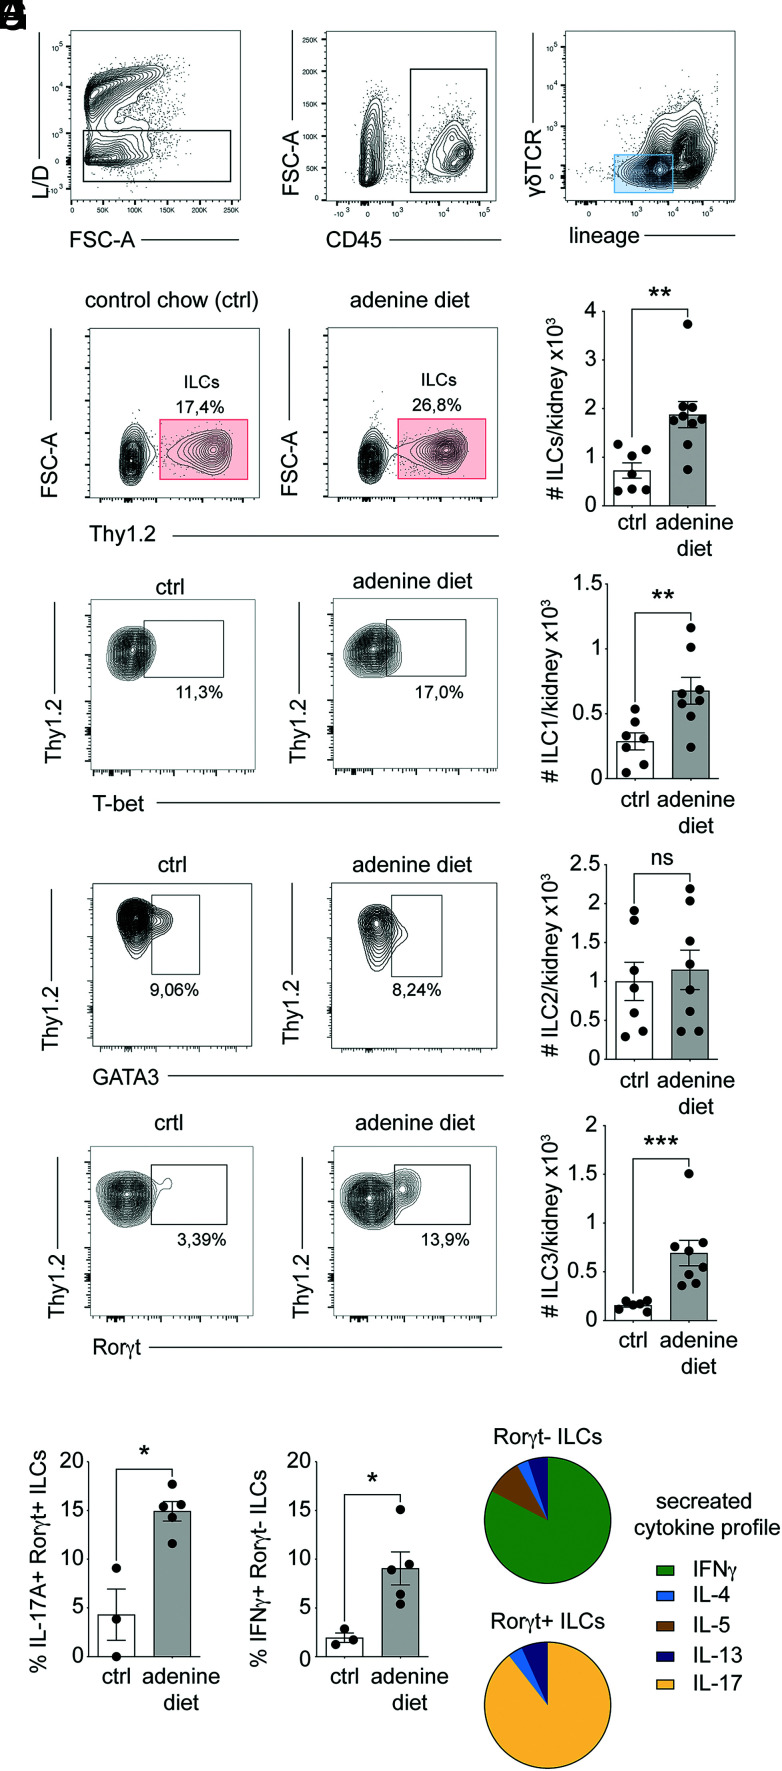
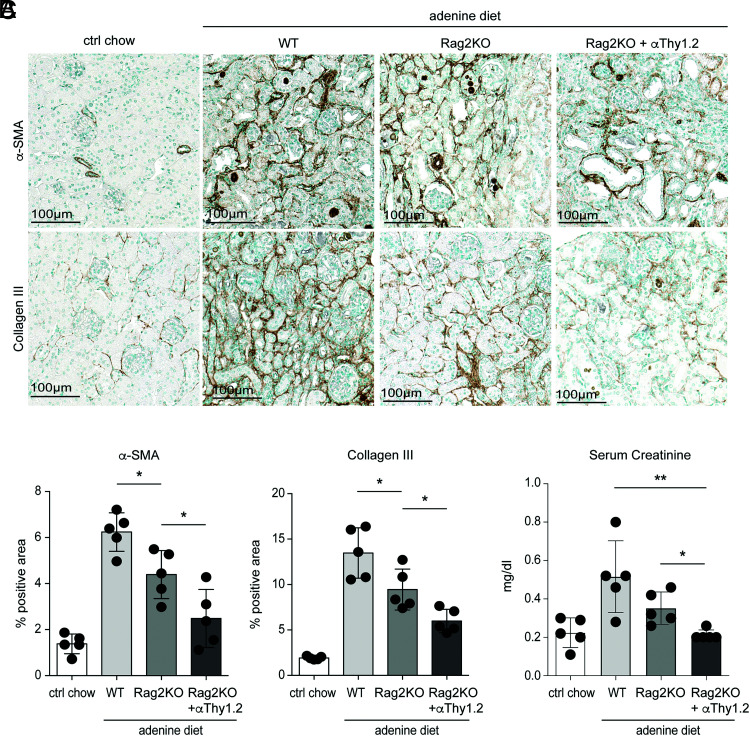
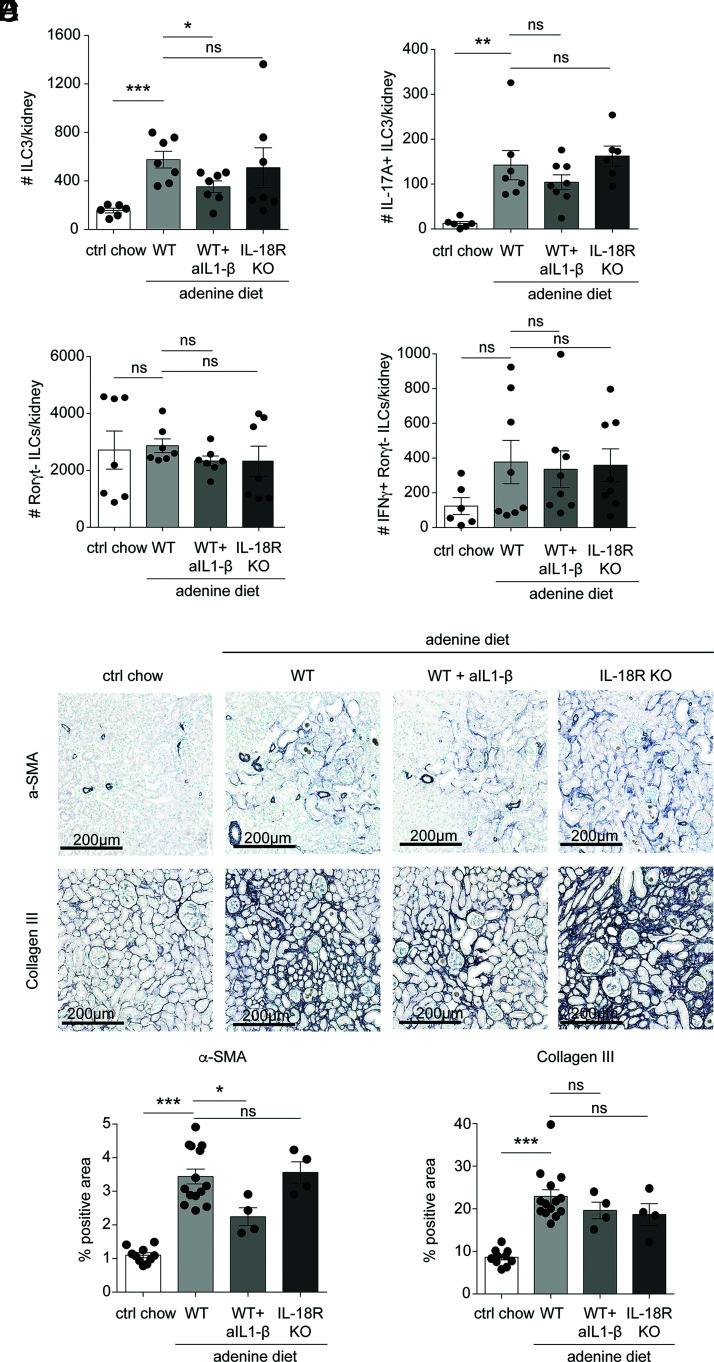
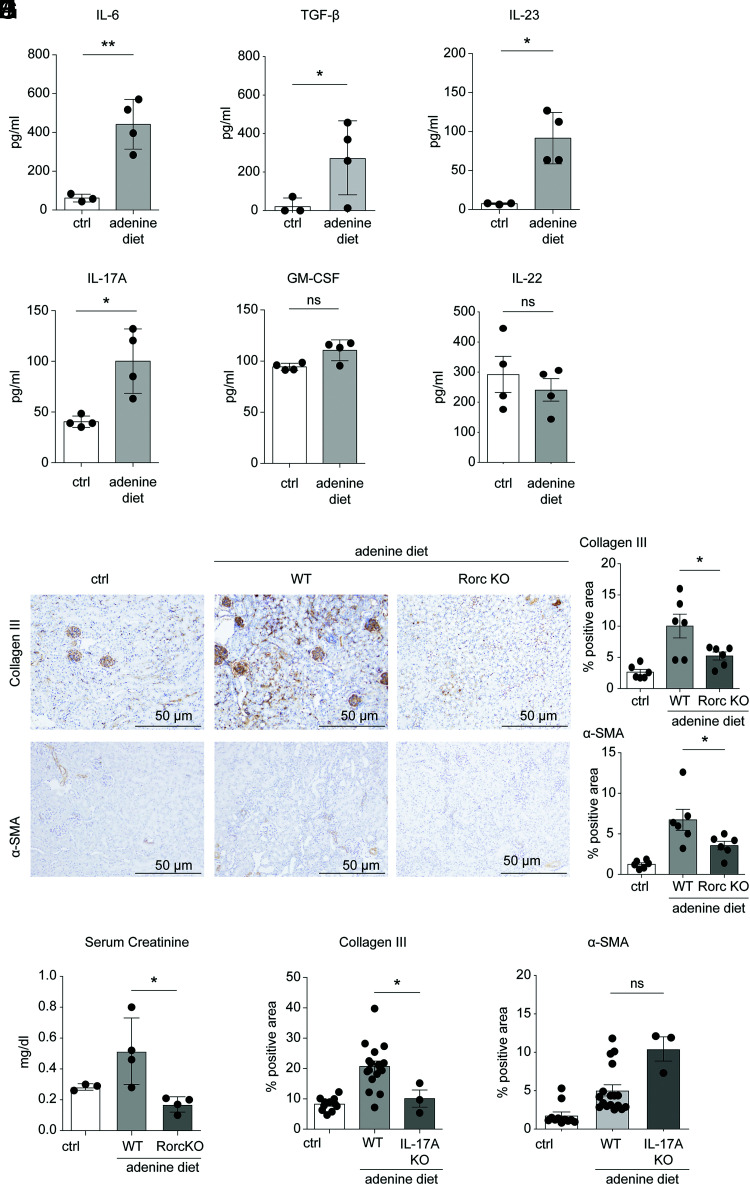
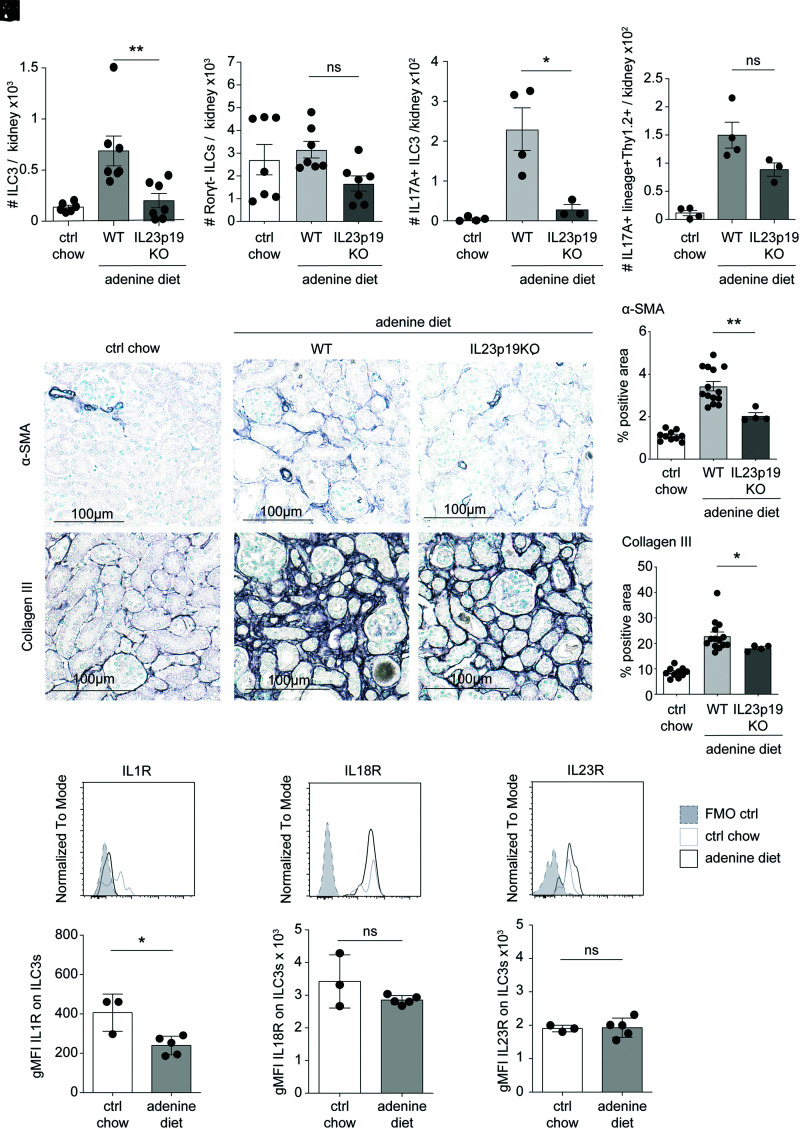
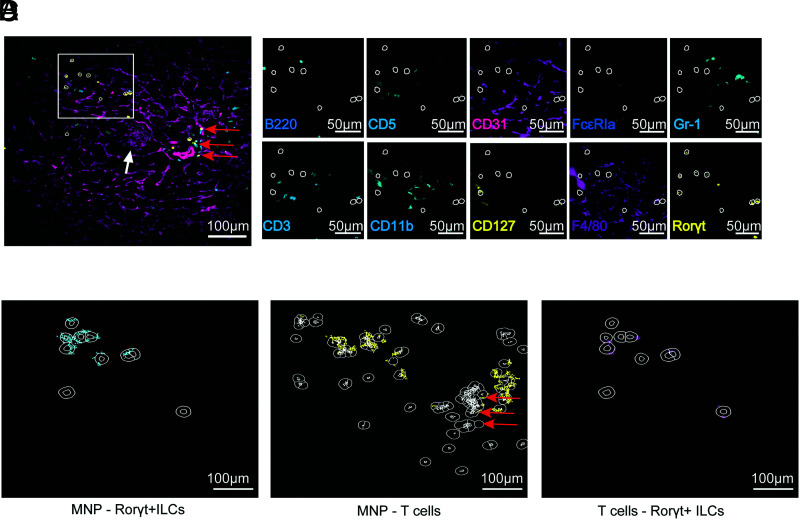
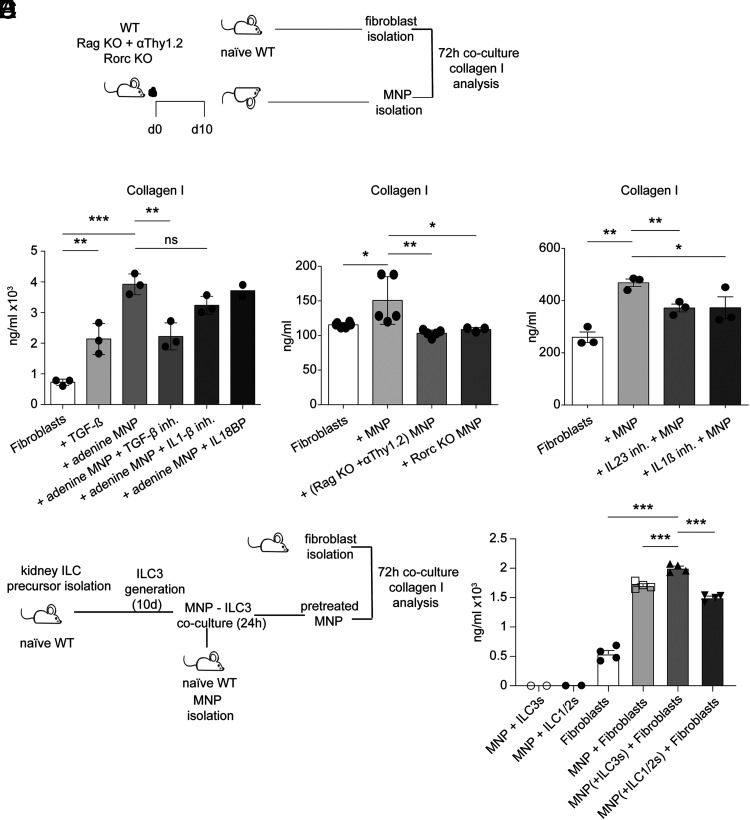
Chronic inflammasome activation in mononuclear phagocytes (MNPs) promotes fibrosis in various tissues, including the kidney. The cellular and molecular links between the inflammasome and fibrosis are unclear. To address this question, we fed mice lacking various immunological mediators an adenine-enriched diet, which causes crystal precipitation in renal tubules, crystal-induced inflammasome activation, and renal fibrosis. We found that kidney fibrosis depended on an intrarenal inflammasome-dependent type 3 immune response driven by its signature transcription factor Rorc (retinoic acid receptor-related orphan receptor C gene), which was partially carried out by type 3 innate lymphoid cells (ILC3s). The role of ILCs in the kidney is less well known than in other organs, especially that of ILC3. In this article, we describe that depletion of ILCs or genetic deficiency for Rorc attenuated kidney inflammation and fibrosis. Among the inflammasome-derived cytokines, only IL-1β expanded ILC3 and promoted fibrosis, whereas IL-18 caused differentiation of NKp46+ ILC3. Deficiency of the type 3 maintenance cytokine, IL-23, was more protective than IL-1β inhibition, which may be explained by the downregulation of the IL-1R, but not of the IL-23R, by ILC3 early in the disease, allowing persistent sensing of IL-23. Mechanistically, ILC3s colocalized with renal MNPs in vivo as shown by multiepitope-ligand cartography. Cell culture experiments indicated that renal ILC3s caused renal MNPs to increase TGF-β production that stimulated fibroblasts to produce collagen. We conclude that ILC3s link inflammasome activation with kidney inflammation and fibrosis and are regulated by IL-1β and IL-23.


Conflict of interest statement

The authors have no financial conflicts of interest.

Figures

None
Graphical abstract
FIGURE 1.
FIGURE 1.
ILC1 and ILC3 are increased during inflammasome-mediated nephritis. WT mice were fed either with control (ctrl) chow or adenine-enriched diet for 14 d to induce crystal-mediated kidney fibrosis. (A) Flow cytometry gating strategy to identify innate lymphocytes in the kidney. Lineage exclusion comprises CD3ε, CD5, αβ-TCR, CD19, Ly6G, CD11c, and CD11b. (BE) Identification and quantification of absolute ILCs numbers (B), renal ILC1 (lineageThy1.2+T-bet+) (C), ILC2 (lineageThy1.2+GATA3+) (D), and ILC3 (lineageThy1.2+Rorγt+) (E). Statistics were calculated using an unpaired Mann–Whitney U test (n = 7–8 mice/group), *p < 0.05, **p < 0.01, ***p < 0.001. Data were pooled from two independent experiments and displayed as mean ± SEM. (F) Percentage of IL-17Α–producing Rorγt+ ILCs or (G) IFN-γ–producing Rorγt ILCs. (H) Cytokine profile of sorted Rorγt+ and Rorγt ILCs from five WT mice on adenine-enriched diet. Statistics were calculated using an unpaired Mann–Whitney U test (n = 5 mice/group), *p < 0.05. One representative of two independent experiments was shown and depicted as mean ± SEM.
FIGURE 2.
FIGURE 2.
Innate lymphocytes promote crystal-induced kidney fibrosis. (A) α-SMA and Collagen III staining of kidney sections (scale bars, 100 μm) from WT mice on control (ctrl) chow and WT, Rag2 KO mice, and Rag2 KO mice treated with anti-Thy1.2 Ab on adenine-enriched diet for 21 d. Depletion was performed on days −1, 3, 6, 9, and 12 of adenine diet. (B) Percentages of α-SMA– and Collagen III–positive areas in kidney sections depicted in (A). (C) Serum creatinine levels in the serum of ctrl chow mice, WT mice, and Rag2 KO mice and treated with anti-Thy1.2 Ab on adenine-enriched diet. Statistics were calculated using a one-way ANOVA with Tukey posttest (n = 4–5 mice/group), *p < 0.05, **p < 0.01. One representative of two independent experiments was shown and depicted as mean ± SD.
FIGURE 3.
FIGURE 3.
IL-1β, but not IL-18, expands intrarenal ILC3 and promotes crystal-induced kidney fibrosis. (AD) Absolute numbers of renal ILC3s (A), IL-17-A+ ILC3s (B), Rorγt ILCs (C), and IFN-γ+Rorγt ILCs of WT mice (D) fed with control (ctrl) chow and WT mice, WT mice treated with 45 μg/mouse of an IL-1β–neutralizing Ab (depletion performed on days 1, 4, 7, and 10), and IL-18R KO mice fed with adenine diet for 14 d. Statistics were calculated using a one-way ANOVA with Tukey posttest (n = 6–8 mice/group), *p < 0.05, **p < 0.01, ***p < 0.001. Data were pooled from two independent experiments and displayed as mean ± SEM. (E) Representative histology of α-SMA and Collagen III staining of kidney sections from WT mice on ctrl chow, WT mice, and WT mice treated with anti–IL-1β Ab, as well as IL-18R KO mice fed with adenine-enriched diet for 14 d (scale bars, 200 μm). (F) Percentages of positively stained areas for α-SMA and Collagen III of groups depicted in (E). Statistics were calculated using a one-way ANOVA with Tukey posttest (n = 4–14 mice/group), *p < 0.05, ***p < 0.001. Data were pooled from two independent experiments and displayed as mean ± SEM.
FIGURE 4.
FIGURE 4.
Type 3 immune cells promote inflammasome-mediated kidney fibrosis. (AC) Cytokine concentration of IL-6 (A), TGF-β (B), and IL-23 (C) in supernatants of CD11c+ renal MNPs from mice on control (ctrl chow) or adenine-enriched diet for 21 d, after culture for 24 h, determined by Luminex. Statistics were calculated using an unpaired Mann–Whitney U test (n = 3–4 mice/group), *p < 0.05, **p < 0.01. One representative of two independent experiments was shown and depicted as mean ± SD. (DF) Cytokine concentrations of IL-17A (D), GM-CSF (E), and IL-22 (F) in kidney homogenates of WT mice on ctrl or adenine-enriched diet for 21 d, measured by Luminex. Statistics were calculated using an unpaired Mann–Whitney U test (n = 4 mice/group), *p < 0.05. One representative of two independent experiments was shown and depicted as mean ± SD. (G) Kidney sections stained for α-SMA and Collagen III from WT mice on ctrl chow, and from WT and Rorc KO mice fed with an adenine-enriched diet for 21 d. Calculation of the percentage of α-SMA–positive (H) or Collagen III–positive (I) areas. Statistics were calculated using a one-way ANOVA with Tukey posttest (n = 6 mice/group), *p < 0.05. Data were pooled from two independent experiments and displayed as mean ± SEM. (H) Creatinine in the serum of indicated mice fed with ctrl or adenine-enriched diet. Statistics were calculated using a one-way ANOVA with Tukey posttest (n = 3–4 mice/group), *p < 0.05. One representative of two independent experiments was shown and depicted as mean ± SD. (I and J) Quantification of Collagen III–positive (I) and α-SMA–positive (J) areas in kidney sections of WT and IL-17A KO mice fed with adenine-enriched diet for 14 d. Statistics were calculated using a one-way ANOVA with Tukey posttest (n = 3–14 mice/group), *p < 0.05. Data were pooled from two independent experiments and displayed as mean ± SEM.
FIGURE 5.
FIGURE 5.
IL-23 maintains ILC3 and promotes crystal-induced kidney fibrosis. (A and B) Absolute cell numbers of renal ILC3 (A) and Rorγt ILCs (B). Statistics were calculated using a one-way ANOVA with Tukey posttest (n = 7 mice/group), **p < 0.01. Data were pooled from two independent experiments and displayed as mean ± SEM. (C and D) Number of either IL-17A+ ILC3s (C) or of lineage+Thy1.2+ cells (D) in healthy WT (control [ctrl] chow) and in IL-23p19 KO mice after 14 d of adenine diet. Statistics were calculated using a one-way ANOVA with Tukey posttest (n = 3–4 mice/group), *p < 0.05. One representative of two independent experiments was shown and depicted as mean ± SEM. (E) Representative α-SMA and Collagen III stainings of kidney sections from WT mice on normal chow (ctrl chow) and WT, as well as IL-23p19 KO mice on adenine-enriched diet for 14 d (scale bars, 100 μm). (F and G) Quantification of histological areas stained for α-SMA (F) and Collagen III (G) from mice depicted in (E). Statistics were calculated using a one-way ANOVA with Tukey posttest (n = 4–14 mice/group), **p < 0.01. Data were pooled from two independent experiments and displayed as mean ± SEM. (HJ) Representative histograms illustrating the expression of IL-1R, IL-23R, and IL-18R on ILC3 in the kidney of mice from ctrl diet (ctrl chow) or adenine diet assessed by flow cytometry. Fluorescence minus one ctrl (FMO) serves as ctrl (gray). (KM) Geometric MFI (gMFI) of the molecular expression of IL-1R, IL-18R, and IL-23R on ILC3s. Statistics were calculated using an unpaired Mann–Whitney U test (n = 3–5 mice/group), *p < 0.05. One representative of two independent experiments was shown and depicted as mean ± SD.
FIGURE 6.
FIGURE 6.
Visualization of intrarenal ILC3s and colocalization with renal MNPs. (AD) Multiplexed histological images of a representative kidney section, where computationally identified ILC3s, defined as Rorγt+lineage (B220, CD5, Gr1, FcεR1a, CD11b, CD3) cells, were shown as white circles. The white arrow marks a glomerulus. The immunofluorescence overlay depicts CD3 (cyan), CD31 (magenta), and Rorγt (yellow), and a region of interest (ROI) is indicated as a white square. Single staining for all relevant markers included in the multiplexed histology are shown for the ROI (ILC inclusion markers in yellow, exclusion markers in cyan, and other markers in magenta). Neighborhood analysis of the ILC3s detected as described in (A) with renal MNPs (B), or T cells with renal MNPs (CD45+F4/80+CD11b+ cells) (C) and ILC3s with T cells (CD45+CD3+ cells) (D) found within a 10-µm radius (considered as neighborhood and shown as white circles). Neighborhood cells around each ILC3 are shown in cyan (B) and magenta (D). Orange arrows in (A) and (C) mark CD3+Rorγt+ Th17 cells.
FIGURE 7.
FIGURE 7.
ILC3s modulate renal MNPs to stimulate Collagen I release by fibroblasts. (A) Experimental design of fibroblast-renal MNP coculture used in experiments shown in (B)–(D). (B) Collagen I production released during fibroblasts-renal MNPs 72-h coculture in the presence of TGF-β inhibitor, IL-1β inhibitor, or IL-18 binding protein (IL-18BP). Or fibroblasts stimulated with TGF-β as control. (C) Collagen I production measured by ELISA during 72-h fibroblasts-renal MNP cultures isolated from indicated genetically modified mouse lines on adenine-enriched diet. (D) Collagen I production released during 72-h fibroblasts-renal MNP coculture in the presence of an IL-23 (IL-23 inh.) or IL-1β inhibitor (IL-1β inh.). (E) In vitro experimental design of ILC3-fibroblast-renal MNP cocultures used in (F). (F) Collagen I production measured by ELISA during 72-h fibroblast-renal MNP coculture. MNPs were preincubated with in vitro–differentiated ILC3 or ILC1/2 for 72 h. Statistics were calculated using a one-way ANOVA with Tukey posttest (n = 2–5 mice/group), **p < 0.01. One representative of two independent experiments was shown and depicted as mean ± SEM.

References

    1. Lamkanfi, M., Dixit V. M.. 2012. Inflammasomes and their roles in health and disease. Annu. Rev. Cell. Dev. Biol. 28: 137–161. - PubMed
    1. Rathinam, V. A., Fitzgerald K. A.. 2016. Inflammasome complexes: emerging mechanisms and effector functions. Cell 165: 792–800. - PMC - PubMed
    1. Zhang, W. J., Chen S. J., Zhou S. C., Wu S. Z., Wang H.. 2021. Inflammasomes and fibrosis. Front. Immunol. 12: 643149. - PMC - PubMed
    1. Moeller, M. J., Kramann R., Lammers T., Hoppe B., Latz E., Ludwig-Portugall I., Boor P., Floege J., Kurts C., Weiskirchen R., Ostendorf T.. 2021. New aspects of kidney fibrosis—from mechanisms of injury to modulation of disease. Front. Med. (Lausanne) 8: 814497. - PMC - PubMed
    1. Labzin, L. I., Heneka M. T., Latz E.. 2018. Innate immunity and neurodegeneration. Annu. Rev. Med. 69: 437–449. - PubMed

MeSH terms

LinkOut - more resources