. 2025 Jan;58(1):e13722.
doi: 10.1111/cpr.13722. Epub 2024 Jul 29.

TGFβ-mediated inhibition of hypodermal adipocyte progenitor differentiation promotes wound-induced skin fibrosis

Affiliations

TGFβ-mediated inhibition of hypodermal adipocyte progenitor differentiation promotes wound-induced skin fibrosis

Meimei Yin et al. Cell Prolif. 2025 Jan.

Abstract

Aberrant activation of dermal fibroblasts during wound healing often leads to debilitating fibrotic changes in the skin, such as scleroderma and keloids. However, the underlying cellular and molecular mechanisms remain elusive. Here, we established a wound-induced skin fibrosis (WISF) mouse model in mature adult mice, characterised by excessive deposition of collagen bundles, loss of dermal adipocytes, and enrichment of DPP4+Ly6A+THY1+ hypodermal interstitial adipocyte progenitors (HI-APs) and pericytes, resembling human fibrotic skin diseases. This WISF model exhibited an age-dependent gain of fibrotic characteristics, contrasting with the wound-induced hair neogenesis observed in younger mice. Through comprehensive analyses of the WISF, we delineated a trajectory of fibroblast differentiation that originates from HI-APs. These progenitors highly expressed several extracellular matrix (ECM) genes and exhibited a TGFβ pathway signature. TGFβ was identified as the key signal to inhibit the adipogenic potential and maintain the fibrogenic potential of dermal APs. Additionally, administering a TGFβ receptor inhibitor to wound scar reduced the abundance of ECM-producing APs. Finally, analysis of human scleroderma skin tissues revealed a negative correlation between the expression of AP-, ECM-, and TGFβ pathway-related genes and PPARG. Overall, this study establishes a wound-induced skin fibrosis mouse model and demonstrates that TGFβ-mediated blockage of HI-AP differentiation is crucial for driving fibrotic pathology. Targeting HI-APs and adipogenesis may provide novel avenues for developing disease-modifying therapies for fibrotic skin diseases.


Conflict of interest statement

The authors declare no conflict of interest.

Figures
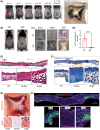
FIGURE 1
FIGURE 1
Establishment of a wound‐induced skin fibrosis model in mature adult mice. (A) Full thickness excisional dorsal wounds (1.5  × 1.5 cm) were created on mouse back skin and pictures were taken at indicated time points post wounding. The right panel shows the zoom‐in image of the undersurface (right) side of the wound at w.d. 26. (B–D) Mice at 3 weeks (3 W, young adult) or 8 weeks (8 W, mature adult) of age were subjected to large skin wounding model as described in A, and wounds were collected wound day (w.d.) 26 for imaging (B, C) and alkaline phosphatase staining (ALP in C). (D) Qualificative bar graphs showing the number of ALP+ hair follicles per field/wound (n = 4/group). All error bars indicate mean ± SEM. ***p < 0.001. (E–H) Skin wounds from mature adult mice w.d. 26 were subjected to various staining analyses, and zoom‐in images of the wound centre, edge or distal regions were shown in the lower panel. (E) HE staining showing skin histology. (F) masson staining showing collagen (blue) expression and deposition. (G) Whole‐mount Oil‐red‐O staining showing the distribution of ORO+ (red) lipid‐droplets. Note that hair follicles can be clearly visualised by black pigmentation. (H) Bodipy (green, marks lipid), PHA (red, phalloidin, marks actin fibre) and DAPI (blue) staining showing the distribution of bodipy+ (green) lipid‐droplets across skin section.
FIGURE 2
FIGURE 2
PDGFRAhiLy6A+DPP4+THY1hi hypodermal APs and PDGFRAACTA2+ pericytes are enriched in the wound centre of the WISF model. (A, B). Cells isolated from the distal control, edge or centre skin tissues from w.d. 26 wounds were subjected to FACS analysis. FACS plots (A) showing the expression of Ly6A and DPP4 on PDGFRA+ dFBs (gating strategy is shown in Figure S1A). (B) Stacked bar graphs showing the quantified percentages of various dFB subpopulations, including DPP4+Ly6Amed dFBs, DPP4loLy6A+ pAds and DPP4+Ly6Ahi APs in PDGFRA+ dFBs across the wound centre, edge and distal regions as indicated (n = 3/group). All error bars indicate mean ± SEM. (C, D) FACS plots (C) showing the expression of Ly6A and THY1 on PDGFRA+ dFBs (w.d. 26). (D) Bar graphs showing the quantified percentages of THY1hiLy6Ahi APs in PDGFRA+ dFBs (n = 3/group). All error bars indicate mean ± SEM. ****p < 0.0001. (E) Immunostaining of THY1 (red), Ly6A (green) and DPP4 (blue), and nuclei were stained by DAPI (white). Scale bar, 200 μm. (F) Immunostaining of CD31 (red), ACTA2 (green) and DAPI (blue for nuclei). Scale bar, 200 μm. (G, H) FACS plots (G) showing the expression of ACTA2 and PDGFRA on CD45 skin cells. Red box marks the ACTA2+PDGFRA pericytes. Bar graphs (H) showing the quantified percentages of ACTA2+PDGFRA pericytes (n = 3/group). All error bars indicate mean ± SEM. *p < 0.05; **p < 0.01; ***p < 0.001.
FIGURE 3
FIGURE 3
Reduced accumulation of HI‐APs and micro‐vessels in WIHN compared to WISF. Mice at 3 weeks (for WIHN) or 8 weeks (for WISF) of age were subjected to large skin wounding models as described in Figure 1, and wound samples were collected for analysis at w.d. 26. (A). HE staining of the WIHN or WISF centre scar tissues as indicated. Zoom‐in panels were shown on the right. Hair follicles were circled by dotted lines, and adipocytes are indicated by asterisks. Scale bar, 200 μm. (B, C). Immunostaining of DPP4 (red), Ly6A (green) and DAPI (white). Scale bar, 200 μm. Wound centre scar regions were marked by dotted‐lines. Zoom‐in panels were shown in C. Hair follicles were marked as ‘h.f.’, and DPP4+Ly6A+ HI‐APs were marked by white arrows. Scale bar, 200 μm. (D). Quantified bar graphs (see FACS plots in Figure S2B,C) showing the percentage of DPP4+Ly6Ahi or THY1hiLy6Ahi APs in PDGFRA+ dFBs in the wound centre of WIHN or WISF tissues as indicated (n = 4/group). All error bars indicate mean ± SEM. ****p < 0.0001.
FIGURE 4
FIGURE 4
Dermal adipocytes are absent in the fibrotic human skin diseases. (A). Masson (collagen in blue) staining of healthy control and keloid skin sections as indicated. Three zoom‐in areas were shown in the lower left panel marked by dotted‐red box. Scale bar, 500 μm. (B). Masson (collagen in blue) staining of healthy control and scleroderma skin sections as indicated. zoom‐in areas of the control or scleroderma were shown on the left or right panel as indicated. Scale bar, 500 μm. (C) Immunostaining of DPP4 (green) and THY1 (red) of healthy control and scleroderma biopsies. White dashed lines marks the interface between the epidermis and dermis or the dermis and WAT tissue. Scale bar, 500 μm. (D) Immunostaining of DPP4 (green) and THY1 (red) in Scleroderma or keloid skin sections as indicated. Scale bar, 200 μm.
FIGURE 5
FIGURE 5
The differentiation trajectory of HI‐APs during wound regeneration. (A) Violin plots showing the expression of marker genes for each cell clusters of total cells from wound centre scar tissue (GSE190175). FB, fibroblasts; PC, pericytes; EC, endothelial cells; SC, Schwann cells. (B) tSNE plot showing the distribution of the five Pdgfra + dFB sub‐clusters. (C) Violin plots showing the expression of differentially expressed genes for each Pdgfra + dFB sub‐clusters. (D–F) Monocle 2‐based trajectory analysis annotated by cell clusters (D), pseudotime analysis (E), and hierarchical clustering annotated by cell clusters (F) of Pdgfra + dFB sub‐clusters. (G) Slingshot‐based lineage and pseudotime analysis predicting the three cell lineages and differentiation trajectory of Pdgfra + dFB sub‐clusters. (H) CytoTRACE analysis predicting the differentiation state of each Pdgfra + dFB sub‐clusters. diff, differentiated. (I) Violin plots showing the enrichment scores of gene‐sets related to adipocytes, adipocyte progentiors (AP), extracellular matrix (ECM), and TGFβ pathway in each dFB cluster. (J) Violin plots showing the expression of indicated ECM genes in each dFB cluster. (K, L) Immunostaining of the WISF centre scar tissues (w.d. 16 or w.d. 25) showing the expression of Ly6A (red), DLK1 (blue), TRPS1 (green) and DAPI (white) in K, and COL1A1 (red), ACTA2 (green) and DAPI (blue) in L. Scale bars, 200 μm.
FIGURE 6
FIGURE 6
TGFβ pathway is the key signal for maintaining fibrogenic function and inhibiting adipogenic function of dermal APs. (A–E) Primary dermal AP/pAds were treated with adipocyte differentiation cocktail for 3 days before cells were collected for analysis. (A) Phase contrast images showing formation of lipid‐laden adipocytes at day 3 post‐differentiation. (B) GO pathway analysis showing top downregulated (blue) or upregulated (red) pathways in differentiated adipocytes compared to undifferentiated AP/pAds. (C) Scatter plot showing top differentially expressed genes in adipocytes and AP/pAds. (D, E) Heatmap (D) or qRT‐PCR (E) showing the mRNA expression kinetics of listed genes during adipocyte differentiation time course (n = 3/group). All error bars indicate mean ± SEM. *p < 0.05; **p < 0.01; ***p < 0.001; ****p < 0.0001. (F) qRT‐PCR analysis of key fibrotic and adipocyte‐related genes in neonatal AP/pAds treated with TGFβ ± TGFBR inhibitor (SB431542, SB) (n = 3/group). All error bars indicate mean ± SEM. *p < 0.05; **p < 0.01; ***p < 0.001; ****p < 0.0001.
FIGURE 7
FIGURE 7
TGFβ pathway is the key inhibitory signal for dermal adipogenesis in the WISF model. (A) ClusterGVis analyses of the wound centre, edge and distal skin RNAseq data identified four gene clusters with distinct expression dynamics. Left panel: the number and expression pattern of genes in each cluster. Right panel: GO analyses of the relevant biological processes for each cluster. (B) Heatmap showing the relative expression of indicated genes. (C–H) Mature adult mice were administrated i.d. with TGFBR inhibitor (SB) or DMSO during the course of WISF, and wounds were collected at w.d. 24. (D) Bodipy staining of skin wounds. Zoom‐in images cropped from the edge area are shown on the right. Scale bar, 1 mm. (E, F) HE staining of the centre scar tissue (E), and quantified results showing the thickness of skin dermis is shown in F (n = 5/group). Scale bar, 200 μm. (G) Immunostaining of COL1A1 (green), THY1 (red), DPP4 (blue) and DAPI (white). Scale bar, 200 μm. (H) qRT‐PCR analysis of key fibrotic or adipocyte‐related genes as indicated (n = 3 ~ 4/group). All error bars indicate mean ± SEM. *p < 0.05; **p < 0.01; ***p < 0.001; ****p < 0.0001.
FIGURE 8
FIGURE 8
Gene expression analysis of AP‐, ECM‐ and TGFβ pathway‐related genes in human scleroderma. (A) Immunostaining of MFAP5 (green), THY1 (red) and COL1 (blue) of scleroderma skin sections. White dashed lines marks the interface between the epidermis and dermis or the dermis and WAT tissue. Zoom‐in images with mixed‐ or single‐colour channels are shown on the right panel. Scale bar, 200 μm. (B) Violin plots showing the expression levels (Fragments Per Kilobase of transcript per Million mapped reads/FPKM values) of genes related to adipocyte progenitors/AP, extracellular matrix/ECM, and TGFβ pathway as shown in healthy controls (n = 33) or scleroderma (SSc) (n = 58) skin samples. All error bars indicate mean ± SEM. ***p < 0.001; ****p < 0.0001. (C) Correlation expression plots of indicated genes. Linear correlation analysis was performed by Pearson correlation coefficient method. The r value represents the correlation coefficient strength, and p value assesses the statistic significance of the correlation.

References

    1. Limandjaja GC, Niessen FB, Scheper RJ, Gibbs S. The keloid disorder: heterogeneity, histopathology, mechanisms and models. Front Cell Dev Biol. 2020;8:360. - PMC - PubMed
    1. Berman B, Maderal A, Raphael B. Keloids and hypertrophic scars: pathophysiology, classification, and treatment. Dermatologic Surg. 2017;43(Suppl 1):S3‐S18. - PubMed
    1. Andrews JP, Marttala J, Macarak E, Rosenbloom J, Uitto J. Keloids: the paradigm of skin fibrosis—pathomechanisms and treatment. Matrix Biol. 2016;51:37‐46. - PMC - PubMed
    1. Gilbane AJ, Denton CP, Holmes AM. Scleroderma pathogenesis: a pivotal role for fibroblasts as effector cells. Arthritis Res Ther. 2013;15(3):215. - PMC - PubMed
    1. Gabrielli A, Avvedimento EV, Krieg T. Scleroderma. N Engl J Med. 2009;360(19):1989‐2003. - PubMed

Substances

LinkOut - more resources