. 2024 Oct;44(10):1106-1129.
doi: 10.1002/cac2.12600. Epub 2024 Jul 28.

Galectin 3-binding protein (LGALS3BP) depletion attenuates hepatic fibrosis by reducing transforming growth factor-β1 (TGF-β1) availability and inhibits hepatocarcinogenesis

Affiliations

Galectin 3-binding protein (LGALS3BP) depletion attenuates hepatic fibrosis by reducing transforming growth factor-β1 (TGF-β1) availability and inhibits hepatocarcinogenesis

Dae-Hwan Kim et al. Cancer Commun (Lond). 2024 Oct.

Abstract

Background: Increased Galectin 3-binding protein (LGALS3BP) serum levels have been used to assess hepatic fibrosis stages and the severity of hepatocellular carcinoma (HCC). Considering the crucial role of transforming growth factor-β1 (TGF-β1) in the emergence of these diseases, the present study tested the hypothesis that LGALS3BP regulates the TGF-β1 signaling pathway.

Methods: The expression levels of LGALS3BP and TGFB1 were analyzed in patients with metabolic dysfunction-associated steatohepatitis (MASH) and HCC. Multiple omics techniques, such as RNA-sequencing, transposase-accessible chromatin-sequencing assay, and liquid chromatography-tandem mass spectrometry proteomics, were used to identify the regulatory mechanisms for the LGALS3BP-TGF-β1 axis. The effects of altered TGF-β1 signaling by LGALS3BP were investigated in conditional LGALS3BP-knockin and LGALS3BP-knockout mice.

Results: In patients with MASH and HCC, the levels of LGALS3BP and TGFB1 exhibited positive correlations. Stimulation of LGALS3BP by the inflammatory cytokine interferon α in HCC cells or ectopic overexpression of LGALS3BP in hepatocytes promoted the expression levels of TGFB1. Aggravated fibrosis was observed in the livers of hepatocyte-specific LGALS3BP-knockin mice, with increased TGFB1 levels. LGALS3BP directly bound to and assembled integrin αV, an integral mediator required for releasing active TGF-β1 from extracellular latent complex with the rearranged F-actin cytoskeleton. The released TGF-β1 activated JunB transcription factor, which in turn promoted the TGF-β1 positive feedback loop. LGALS3BP deletion in the hepatocytes downregulated TGF-β1 signaling and CCl4 induced fibrosis. Moreover, LGALS3BP depletion hindered hepatocarcinogenesis by limiting the availability of fibrogenic TGF-β1.

Conclusion: LGALS3BP plays a crucial role in hepatic fibrosis and carcinogenesis by controlling the TGF-β1 signaling pathway, making it a promising therapeutic target in TGF-β1-related diseases.

Keywords: FAK; F‐actin; Integrin αV; Interferon α; JunB; LGALS3BP; TGF‐β1; hepatic carcinogenesis; metabolic dysfuntion‐associated steatohepatitis; tensile force.


Conflict of interest statement

None.

Figures

FIGURE 1
FIGURE 1
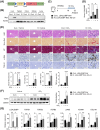
Correlation of TGFB1 expression with LGALS3BP expression in HCC patients. (A) Reactome pathway analysis of genes that showed a positive correlation with LGALS3BP expression in TCGA HCC data (n = 366). (B) Venn diagram showing common genes between the gene sets. (C) The correlation between LGALS3BP and TGFB1, TGFB2, or TGFB3 levels in HCC from TCGA dataset (n = 366). (D) The correlation between LGALS3BP and TGFB family members in tumoral tissues of HCC patients at CNUHH (n = 83). (E) The correlation between LGALS3BP and TGFB family members in peri‐tumoral normal tissues of HCC patients at CNUHH (n = 83). The Pearson's correlation coefficient (R) and two‐tailed P values are indicated in each graph. Abbreviations: CNUHH, chonnam national university hwasun hospital; COL1A2, collagen type I alpha 2; HCC, hepatocellular carcinoma; LGALS3BP, lectin galactoside‐binding soluble 3 binding protein; MMP2, matrix metallopeptidase 2; MMP9, matrix metallopeptidase 9; TCGA, the cancer genome atlas; TGFB1, transforming growth factor beta 1.
FIGURE 2
FIGURE 2
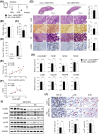
Effect of hepatic LGALS3BP overexpression on TGFB1 upregulation and exacerbation of CCl4‐induced hepatic fibrosis. (A) Schematic illustration of LGALS3BP‐KI construct. The myc‐epitope‐tagged LGALS3BP was ectopically expressed by the removal of long poly‐A sequences (STOP) with Cre recombinase. (B) Western blottings to detect ectopic LGALS3BP expression in whole‐cell lysates from indicated tissues. (C) Experimental outline of the mouse model of hepatic fibrosis. LGALS3BP fl/wt or LGALS3BP fl/wt; Alb‐Cre mice were intraperitoneally injected with CCl4 twice per week for 4 weeks. All the mice were euthanized at 22 weeks of age. (D) ELISA assays to measure serum LGALS3BP levels at the time of the sacrifice. Data represented as mean ± SD, n = 3 (vehicle injected group) or n = 5 (CCl4 injected group). *P < 0.05, **P < 0.01, and ***P < 0.001 (Two‐way ANOVA). (E) Representative images of H&E, Sirius Red, MT staining, immunohistochemical staining of α‐SMA or TGF‐β1 in the liver tissues of the indicated mice. Quantification of the positively stained area were shown below. The stained areas were shown as percentages of the total area of each liver sections. Data represented as mean ± SD, n = 4‐9. *P < 0.05, **P < 0.01, and ***P < 0.001 (Two‐way ANOVA). (F) Representative TGF‐β1 western blotting of each group using whole‐cell extracts from liver tissues. Quantification of the band intensities were shown on the left. (G) qRT‐PCR analysis of the indicated genes. Data represented as mean ± SD, n = 3 (vehicle injected groups) or n = 5 (CCl4 injected groups). *P < 0.05, **P < 0.01, and ***P < 0.001 (Two‐way ANOVA). Abbreviations: Alb‐cre, albumin promoter controlled cre recombinase; COL1A1, collagen type I alpha 1; Cont., control; fl/wt, floxed and wild type; H&E, hematoxylin and eosin stain; KI, knockin; LG3BP‐myc, myc epitope tagged lectin galactoside‐binding soluble 3 binding protein; MT, Masson's trichrome stain; VCAM1, Vascular cell adhesion protein 1; α‐SMA, alpha‐smooth muscle actin.
FIGURE 3
FIGURE 3
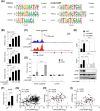
Induction of TGFB1 and its target gene expression by recombinant LGALS3BP treatment. (A) qRT‐PCR of TGFB1 expression in Hepa‐1c1c7 cells treated with indicated concentration of rLGALS3BP for 6 h. (B) Representative western blottings of whole‐cell extracts from rLGALS3BP treated Hepa‐1c1c7 cells. (C) Volcano plots showing differentially expressed genes upon rLGALS3BP treatment (compared to the vehicle‐treated group; n = 3). (D) Pathway analyses of the upregulated gene sets upon rLGALS3BP treatment. (E) Pathway analyses of the downregulated gene sets upon rLGALS3BP treatment. (F) Heatmap of genes involved in TGF‐β regulation of extracellular matrix of the Bioplanet pathway indicated in (D). (G) qRT‐PCR validation of the RNA‐seq results. Data represented as mean ± SD, n = 3. **P < 0.01 and ***P < 0.001 (Student's t‐test). Abbreviations: DEG, differentially expressed genes; IL6, interleukin‐6; PDGFB, platelet derived growth factor subunit B; p‐SMAD2, phosphorylated SMAD2; rLGALS3BP, recombinant LGALS3BP; SERPINE1, serine proteinase inhibitor E1; SMAD2, mothers against decapentaplegic homolog 2; TGFB1, transforming growth factor beta 1; VCAM1, vascular cell adhesion protein 1.
FIGURE 4
FIGURE 4
Regulation of TGFB1 expression by JunB with rLGALS3BP treatment. (A) Identification of enriched transcription factor binding motifs with unique chromatin‐accessible peaks in the vehicle‐ and rLGALS3BP‐treated cells from ATAC‐seq. (B) JUN/AP‐1 luciferase assays using indicated HCC cell lines with rLGALS3BP treatment for 6h. Data represented as mean ± SD, n = 3. Data represented as mean ± SD, n = 3. **P < 0.01 and ***P < 0.001 (Student's t‐test to non‐treated controls). (C) Chromatin accessibility of the TGFB1 locus. The locations of the three JunB‐binding motifs are indicated, and arrows denote the amplicons of the JunB‐binding sites of TGFB1. (D) JunB ChIP‐qPCR for TGFB1 JunB‐RE locus using Hepa‐1c1c7 cells upon rLGALS3BP treatment for 6h. The UNTR4 region served as the negative control. Data represented as mean ± SD, n = 3. ***P < 0.001 (Student's t‐test). (E) qRT‐PCR results (upper) and western blot analysis (lower) of Hepa‐1c1c7 cells. Cells were transfected with JUNB‐specific siRNA or a negative control siRNA for 24h then serum‐starved before treated with rLGALS3BP for 6h. Data represented as mean ± SD, n = 3. ***P < 0.001 (Student's t‐test). (F) qRT‐PCR to measure JUNB expression of the control and LGALS3BP‐KI primary hepatocytes. Data represented as mean ± SD, n = 3. ***P < 0.001 (Student's t‐test). (G) The correlation between LGALS3BP and JUNB in HCC from TCGA dataset (n = 366). (H) The correlation between LGALS3BP and JUNB in tumoral tissues of HCC patients at CNUHH (n = 83). (I) The correlation between LGALS3BP and JUNB in peri‐tumoral normal tissues of HCC patients at CNUHH (n = 83). *P < 0.05, **P < 0.01, and ***P < 0.001 (Two‐way ANOVA). Abbreviations: ATAC‐seq, the assay for transposase‐accessible chromatin with sequencing; ATF4, activating transcription factor 4; Cont, control; FOSL2, FOS like 2; FOXA1, forkhead box protein A1; FOXO3, forkhead box protein O3; JUNB‐RE, JunB response elements; KI, LGALS3BP knockin; rLGALS3BP, recombinant LGALS3BP; TEAD4, TEA domain transcription factor 4; UNTR6, untranscribed region 6.
FIGURE 5
FIGURE 5
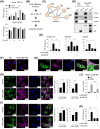
Interaction of LGALS3BP with ITGαV and promotion of ITGαV accumulation on the cell membrane to release TGF‐β1. (A) Measurement of active TGF‐β1 and total TGF‐β1 in the culture medium of Hepa‐1c1c7 cells upon rLGALS3BP treatment. (B) Experimental outline: whole cell extracts of LGALS3BP‐KI primary hepatocytes were immunoprecipitated with normal IgG or α‐myc. Immunoprecipitants were analyzed by LC‐MS/MS. (C) Protein‐protein interactions in the cluster 4 among the LGALS3BP‐binding protein networks. (D) Co‐immunoprecipitation assays to detect the interaction between secreted LGALS3BP and ITG proteins using anti‐myc antibody with whole cell extracts of empty vector or myc‐LGALS3BP transfected SNU449 cells. (E) ELISA for the detection of active TGF‐β1 in Hepa‐1c1c7, SNU447, and HepG2 cells in the culture medium upon rLGALS3BP ± GLPG0187 treatment. Data represented as mean ± SD, n = 3. *P < 0.05 and **P < 0.05 (Two‐way ANOVA). (F) Representative images of PLA results using HepG2 cells. Empty vector or myc‐epitope tagged LGALS3BP was transiently transfected into HepG2 cells to detect its interaction with ITGαV. Red dots indicate the protein‐protein interactions. Blue dots denote DAPI nuclei staining. (G) Immunofluorescence staining of transfected myc‐LGALS3BP (Green) and ITGαV (Pink). (H) Immuno‐fluorescence staining of ITGαV and F‐actin in Hepa‐1c1c7 cells upon rLGALS3BP treatment for 1h. Quantification of total stained area of ITGαV and F‐actin were shown on the left with five scanned images per slides of three independent experiments. Data represented as mean ± SD, **P < 0.01 and ***P < 0.001 (Student's t‐test). (I) Immunofluorescence staining of ITGαV and F‐actin in HepG2 cells upon rLGALS3BP treatment for 1h. Quantification of total stained area of ITGαV and F‐actin were shown on the left with five scanned images per slides of three independent experiments. Data represented as mean ± SD, *P < 0.05 and ***P < 0.001 (Student's t‐test). (J) JunB ChIP‐qPCR analysis of TGFB1 JUNB‐RE locus using Hepa‐1c1c7 cells upon rLGALS3BP ± GLPG0187 treatment. Data represented as mean ± SD, n = 3. ***P < 0.001 (Student's t‐test). (K) Measurement of active TGF‐β1 in the culture medium of Hepa‐1c1c7 cells upon rLGALS3BP ± Defactinib treatment. Data represented as mean ± SD, n = 3. *P < 0.05, **P < 0.01, and ***P < 0.001 (Student's t‐test). Abbreviations: DAPI, 4′,6‐diamidino‐2‐phenylindole; F‐actin, filamentous actin; IP, immunoprecipitation; ITGαV, integrin subunit alpha V; JUNB‐RE, JunB response elements; LC‐MS/MS, Liquid Chromatography with tandem mass spectrometry; PH, primary hepatocytes; PLA, Proximity Ligation Assay; rLGALS3BP, recombinant LGALS3BP; TGFB1, transforming growth factor beta 1; WCE, whole cell extract.
FIGURE 6
FIGURE 6
JunB‐TGF‐β1 feedback loop initiation by LGALS3BP via the activation of ITGαV‐mediated rearrangement of F‐actin cytoskeleton. (A) Immunofluorescence staining of phosphorylated FAK and F‐actin in Hepa‐1c1c7 cells upon rLGALS3BP ± GLPG0187 treatment for 1h. Quantification of total stained area of p‐FAK and the length of elongated filamentous actin from the p‐FAK loci were shown on the left with five scanned images per slides of three independent experiments. Total numbers of F‐actin used in the measurement were n = 54, n = 120, n = 67, and n = 69 from the left column. Data represented as mean ± SD, ***P < 0.001 (Two‐way ANOVA). (B) qRT‐PCR analyses to measure the expression levels of JUNB and TGFB1 in Hepa‐1c1c7 cells upon rLGALS3BP ± GLPG0187 treatment. Data represented as mean ± SD, **P < 0.01 and ***P < 0.001 (Two‐way ANOVA). (C) Western blottings to detect the expression levels of indicated proteins. Quantification of the band intensities were shown on the left. Data represented as mean ± SD, n = 3. ***P < 0.001 (Two‐way ANOVA). (D) Immunofluorescence staining of phosphorylated FAK and F‐actin in SNU449 cells upon rLGALS3BP ± GLPG0187 treatment for 1h. Quantification of total stained area of p‐FAK and the length of elongated filamentous actin from the p‐FAK loci were shown on the left with five scanned images per slides of three independent experiments. Total numbers of F‐actin used in the measurement were n = 41, n = 80, n = 30, and n = 35 from the left column. Data represented as mean ± SD, ***P < 0.001 (Two‐way ANOVA). (E) qRT‐PCR analyses to measure the expression levels of JUNB and TGFB1 in SNU449 cells upon rLGALS3BP ± GLPG0187 treatment. Data represented as mean ± SD, *P < 0.05, **P < 0.01, and ***P < 0.001 (Two‐way ANOVA). (F) Western blots to detect the expression levels of indicated proteins. Quantification of the band intensities were shown on the left. Data represented as mean ± SD, n = 3. *P < 0.05, **P < 0.01, and ***P < 0.001 (Two‐way ANOVA). Abbreviations: DAPI, 4′,6‐diamidino‐2‐phenylindole; F‐actin, filamentous actin; F‐actin, filamentous actin; ITGαV, integrin subunit alpha V; p‐FAK, phosphorylated focal adhesion kinase; rLGALS3BP, recombinant LGALS3BP; TGFB1, transforming growth factor beta 1.
FIGURE 7
FIGURE 7
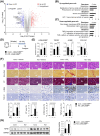
Downregulation of TGF‐β1 signaling and CCl4‐induced fibrosis by LGALS3BP depletion. (A) Volcano plots of DEGs of the primary hepatocytes from LGALS3BP‐KO mice compared with its control littermates (n = 3). (B) Pathway analyses of the upregulated genes. (C) Pathway analyses of the downregulated genes. (D) Experimental outline of the mouse model of hepatic fibrosis; LGALS3BP+/+ or LGALS3BP−/− mice were intraperitoneally injected with CCl4 twice per week for 6 weeks. All the mice were euthanized at 15 weeks of age. (E) qRT‐PCR analysis of the indicated genes in the liver tissues. Data represented as mean ± SD, n = 6 (vehicle injected groups) or n = 7 (CCl4 injected groups). *P < 0.05, **P < 0.01 and ***P < 0.001 (Two‐way ANOVA). (F) Representative images of H&E, Sirius Red, MT staining, immunohistochemical staining of α‐SMA or TGF‐β1 in the liver tissues. Quantification of the positively stained area were shown below. The stained areas were shown as percentages of the total area of each liver sections. Data represented as mean ± SD, n = 4‐9. *P < 0.05, **P < 0.01, and ***P < 0.001 (Two‐way ANOVA). (G) Representative TGF‐β1 western blotting of each group. Quantification of the band intensities were shown on the left. Data represented as mean ± SD, n = 3. *P < 0.05, **P < 0.01 and ***P < 0.001 (Two‐way ANOVA). Abbreviations: COL1A1, collagen type I alpha 1; Cont., control; DEG, differentially expressed genes; H&E, hematoxylin and eosin stain; KO, knockout; LGALS3BP, lectin galactoside‐binding soluble 3 binding protein; MT, Masson's trichrome stain; TGFB1, transforming growth factor beta 1; α‐SMA, alpha‐smooth muscle actin.
FIGURE 8
FIGURE 8
Reduction of the steatohepatitis‐induced hepatocarcinogenesis by LGALS3BP depletion. (A) Experimental outline of the HCC mouse model. LGALS3BP +/+ and LGALS3BP −/− mice were injected intraperitoneally with 25 mg/kg DEN at 2 weeks after birth and fed an HFD for 26 weeks beginning at 6 weeks of age. All the mice were euthanized at 32 weeks of age. (B) Body weights of control and LGALS3BP‐KO mice on the day of euthanasia (n = 12‐13). (C) Tumor scores of the control and KO mouse livers. Tumors ≤ 5 mm were assigned a value of 1 and tumors > 5 mm were multiplied by 2. Tumor scores were determined as the sum of the values. Data represented as mean ± SD, n = 12‐13. ***P < 0.001 (Student's t‐test). (D) ELISA assays for the measurement of active or total TGF‐β1 levels in the serum at the time of the sacrifice. Data represented as mean ± SD, n = 12‐13. **P < 0.01 (Student's t‐test) (E) The correlation between the tumor score and serum LGALS3BP levels in the control mice (n = 12). (F) The correlation between the TGFB1 and LGALS3BP in the tumor tissues of control mice. (G) Upper panels: whole tumor‐bearing mouse livers and its H&E‐stained sections; lower panels: liver sections stained with H&E, Sirius Red, MT, and α‐SMA IHC. Quantification of the positive stained areas were shown on the left. The stained areas were shown as percentages of the total area of each liver sections. Data represented as mean ± SD, n = 10‐12. **P < 0.01 and ***P < 0.001 (Student's t‐test). (H) qRT‐PCR analysis of the indicated genes in hepatic tumors isolated from control and LGALS3BP‐KO mice. Data represented as mean ± SD, n = 10‐12. *P < 0.05, **P < 0.01 and ***P < 0.001 (Student's t‐test). (I) Representative western blottings to detect the expressions of indicated proteins in the cont. and KO mice liver tissues. (J) Representative immunohistochemical staining of TGF‐β1, JunB, and Ki‐67 in the indicated mouse liver tissues. Quantification of the positively stained area were shown below. The stained areas were shown as percentages of the total area of each liver sections. Data represented as mean ± SD, n = 16‐17 for TGF‐β1, n = 10‐11 for JunB and Ki‐67. *P < 0.05, **P < 0.01, and ***P < 0.001 (Student's t‐test). Abbreviations: COL1A1, collagen type I alpha 1; Cont., control; DEN, diethylnitrosamine; GAPDH, glyceraldehyde 3‐phosphate dehydrogenase; H&E, hematoxylin and eosin stain; H&E, hematoxylin and eosin stain; HFD, high fat diet; ITGaV, integrin subunit alpha V; KO, knockout; LGALS3BP, lectin galactoside‐binding soluble 3 binding protein; MT, Masson's trichrome stain; MT, Masson's trichrome stain; PDGFB, platelet derived growth factor subunit B; p‐FAK, phosphorylated focal adhesion kinase; SMA, alpha‐smooth muscle actin; TGFB1, transforming growth factor beta 1; VCAM1, vascular cell adhesion protein 1; α‐SMA, alpha‐smooth muscle actin.

References

    1. Llovet JM, Kelley RK, Villanueva A, Singal AG, Pikarsky E, Roayaie S, et al. Hepatocellular carcinoma. Nat Rev Dis Primers. 2021;7(1):6. - PubMed
    1. Ringelhan M, Pfister D, O'Connor T, Pikarsky E, Heikenwalder M. The immunology of hepatocellular carcinoma. Nat Immunol. 2018;19(3):222–232. - PubMed
    1. Craig AJ, von Felden J, Garcia‐Lezana T, Sarcognato S, Villanueva A. Tumour evolution in hepatocellular carcinoma. Nat Rev Gastroenterol Hepatol. 2020;17(3):139–152. - PubMed
    1. Xu G, Xia Z, Deng F, Liu L, Wang Q, Yu Y, et al. Inducible LGALS3BP/90K activates antiviral innate immune responses by targeting TRAF6 and TRAF3 complex. PLoS Pathog. 2019;15(8):e1008002. - PMC - PubMed
    1. Loimaranta V, Hepojoki J, Laaksoaho O, Pulliainen AT. Galectin‐3‐binding protein: A multitask glycoprotein with innate immunity functions in viral and bacterial infections. J Leukoc Biol. 2018;104(4):777–786. - PubMed

MeSH terms