. 2024 Jul;14(7):e1771.
doi: 10.1002/ctm2.1771.

Endotypes of severe neutrophilic and eosinophilic asthma from multi-omics integration of U-BIOPRED sputum samples

Affiliations

Endotypes of severe neutrophilic and eosinophilic asthma from multi-omics integration of U-BIOPRED sputum samples

Nazanin Zounemat Kermani et al. Clin Transl Med. 2024 Jul.

Abstract

Background: Clustering approaches using single omics platforms are increasingly used to characterise molecular phenotypes of eosinophilic and neutrophilic asthma. Effective integration of multi-omics platforms should lead towards greater refinement of asthma endotypes across molecular dimensions and indicate key targets for intervention or biomarker development.

Objectives: To determine whether multi-omics integration of sputum leads to improved granularity of the molecular classification of severe asthma.

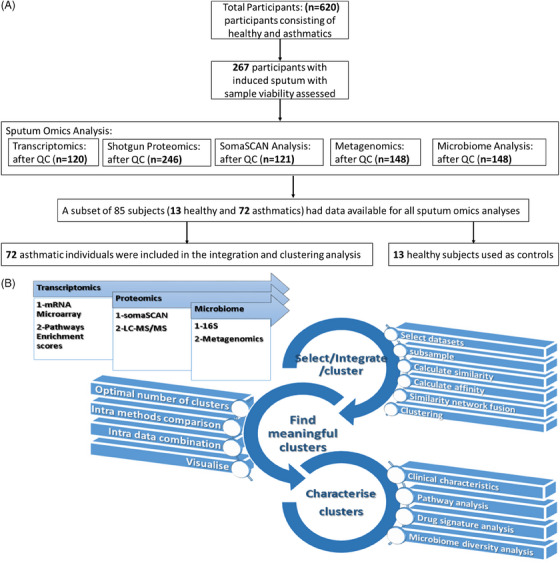
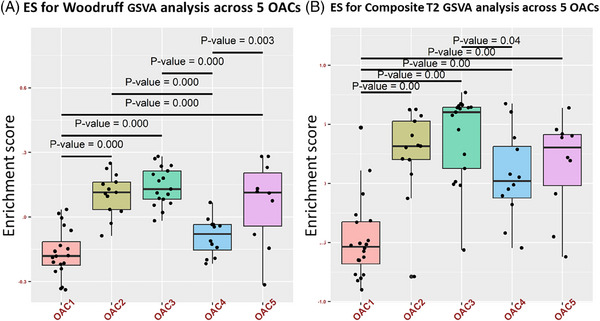
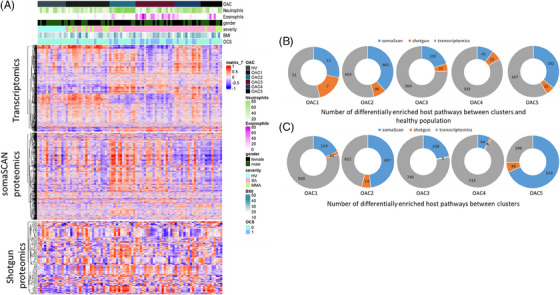
Methods: We analyzed six -omics data blocks-microarray transcriptomics, gene set variation analysis of microarray transcriptomics, SomaSCAN proteomics assay, shotgun proteomics, 16S microbiome sequencing, and shotgun metagenomic sequencing-from induced sputum samples of 57 severe asthma patients, 15 mild-moderate asthma patients, and 13 healthy volunteers in the U-BIOPRED European cohort. We used Monti consensus clustering algorithm for aggregation of clustering results and Similarity Network Fusion to integrate the 6 multi-omics datasets of the 72 asthmatics.

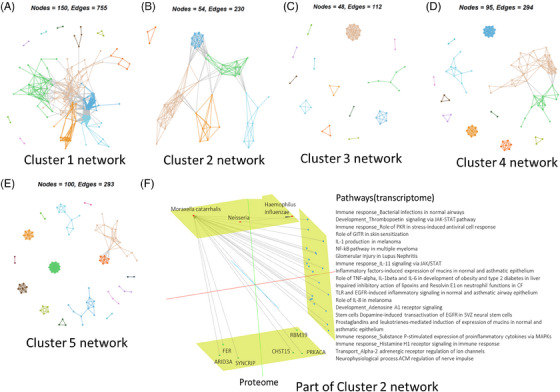
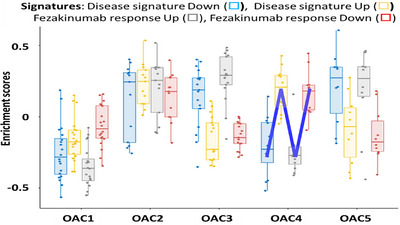
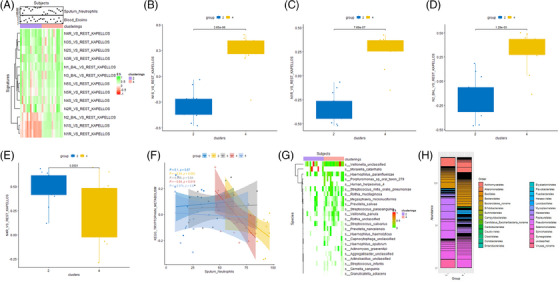
Results: Five stable omics-associated clusters were identified (OACs). OAC1 had the best lung function with the least number of severe asthmatics with sputum paucigranulocytic inflammation. OAC5 also had fewer severe asthma patients but the highest incidence of atopy and allergic rhinitis, with paucigranulocytic inflammation. OAC3 comprised only severe asthmatics with the highest sputum eosinophilia. OAC2 had the highest sputum neutrophilia followed by OAC4 with both clusters consisting of mostly severe asthma but with more ex/current smokers in OAC4. Compared to OAC4, there was higher incidence of nasal polyps, allergic rhinitis, and eczema in OAC2. OAC2 had microbial dysbiosis with abundant Moraxella catarrhalis and Haemophilus influenzae. OAC4 was associated with pathways linked to IL-22 cytokine activation, with the prediction of therapeutic response to anti-IL22 antibody therapy.

Conclusion: Multi-omics analysis of sputum in asthma has defined with greater granularity the asthma endotypes linked to neutrophilic and eosinophilic inflammation. Modelling diverse types of high-dimensional interactions will contribute to a more comprehensive understanding of complex endotypes.

Key points: Unsupervised clustering on sputum multi-omics of asthma subjects identified 3 out of 5 clusters with predominantly severe asthma. One severe asthma cluster was linked to type 2 inflammation and sputum eosinophilia while the other 2 clusters to sputum neutrophilia. One severe neutrophilic asthma cluster was linked to Moraxella catarrhalis and to a lesser extent Haemophilus influenzae while the second cluster to activation of IL-22.

Keywords: asthma endotype; consensus clustering; eosinophilic inflammation; gene set variation analysis; neutrophilic inflammation; pathogenic bacteria; severe asthma; similarity network fusion.


Conflict of interest statement

Mrs. Zounemat‐Kermani has nothing to declare. Dr. Maitland‐van der Zee has received grants from Health Holland and she is the PI of a P4O2 (Precision Medicine for more Oxygen) public–private partnership sponsored by Health Holland involving many private partners that contribute in cash and/or in kind (Boehringer Ingelheim, Breathomix, Fluidda, Ortec Logiqcare, Philips, Quantib‐U, Smartfish, SODAQ, Thirona, TopMD and Novartis), received unrestricted research grants from GSK, Boehringer Ingelheim and Vertex, received consulting fees paid to her institution from Boehringer Ingelheim and AstraZeneca, and received honoraria for lectures paid to her institution from GlaxoSmithKline – outside the submitted work. Dr. Dahlén reports personal fees from AZ, Cayman Chemicals, GSK, Novartis, Regeneron, Sanofi, TEVA, outside the submitted work. Dr. Chung has received honoraria for participating in Advisory Board meetings of Roche, Merck, Shionogi and Rickett‐Beckinson and has also been renumerated for speaking engagements for Novartis and AZ. Dr. Djukanovic declares consulting fees from Synairgen, Sanofi and Galapagos, lecture fees from GSK, AZ and Airways Vista and he holds shares from Synairgen. Dr. Li, Mr. Versi, Dr. Badi, Dr. Sun, Dr. Abdel‐Aziz and Mrs. Bonatti have nothing to declare.

Figures

FIGURE 1
FIGURE 1
Machine learning workflow. (A) CONSORT flow chart reporting the patients and controls we studied. (B) Three types of data were the starting point of the workflow, that is, transcriptomics, proteomics and microbiome date. Each of these three data types included 2 data matrices either derived by incorporating available knowledge or from various bioanalytical platforms, for example, proteomics data from LC‐MS/MS and somaSCAN, microbiome from 16S and Metagenomics platforms. The workflow consists of three main multi‐faceted compartments: (1) select/integrate/cluster, (2) find meaningful clusters, (3) characterise clusters. The first compartment is about running a data integration and clustering algorithm on different combination of data and generating clusters. The second compartment includes multiple steps to calculate, compare and visualise various groupings generated by the first compartment. The goal of this step is to aid decision making about the optimal number of clusters. Finally, the third compartment characterises the only clustering result that is deemed to be most suitable and stable through the second compartment.
FIGURE 2
FIGURE 2
Enrichment of type 2 (T2) inflammation in omics‐associated cluster (OAC)3. Gene set variation analysis (GSVA) boxplots showing the enrichment score (ES) for the Woodruff T2 signature (A) and a composite T2 cytokine and mediator panel (B) in sputum omics‐associated cluster (OAC)3 compared to other OACs.
FIGURE 3
FIGURE 3
Network visualisation of clusters formed by interaction between omics and a multi‐channel view of omics interactions related to omics‐associated cluster (OAC)2. Communities in the multi‐omics data detected via random walks clustering for OAC1 (A), OAC2 (B), OAC3 (C), OAC4 (D) and OAC5 (E). (F) Highlights proteins and pathways that serve as distinctive signatures of OAC2, showcasing their interaction with microbiome signatures (r > .4) and are shown using the Arena3Dweb tool.
FIGURE 4
FIGURE 4
Enrichment of genes, proteins and pathways across the sputum omics‐associated clusters. (A) Heatmap of 72 asthmatic subjects (columns) with 1472, 1362 and 781 pathways (rows) based on the gene set variation analysis (GSVA) of transcriptomic, somaScan and shotgun proteomics datasets, respectively. The sputum neutrophil and eosinophil percentages, sex, oral corticosteroids (OCS) use, body mass index (BMI), and asthma severity for each participant are mapped above the Heatmap. (B) Piechart of number of differentially enriched pathways between clusters and healthy population (q value < .05). The numbers on the segments are number of differentially enriched pathways between the 5 omics‐associated clusters (OACs) and healthy volunteers (HV). (C) Pie chart of the number of differentially enriched pathways between clusters (q value < .05). The numbers on the segments show differentially enriched pathways by one versus comparison (e.g. OAC1 vs. OAC2:5). Pie charts are coloured based on the datasets: SomaScan in blue, shotgun proteomics in orange and transcriptomics in grey. SA, severe asthma; MMA, mild and moderate asthma.
FIGURE 5
FIGURE 5
Gene set variation analysis (GSVA) of disease and anti‐IL‐22 (Fezakinumab, Fz) response signatures across 5 omics‐associated clusters (OACs)1‐5. Significantly down‐ and upregulated genes expressed in disease (Disease signature Down □ and Up □), and genes that are significantly up‐ and downregulated by Fz (Fz response Up □, FZ response Down □) are shown for OACs 1–5. A cluster that is likely to respond to Fz will have a low Disease Down and Fz Up signature enrichment and a high Disease Up and Fz Down signature. This results in an ‘N’‐shaped response (indicated in blue). This criterion is met by OAC4.
FIGURE 6
FIGURE 6
Differential enrichment of neutrophil subsets between neutrophil‐enriched omic‐associated clusters (OAC2) and OAC4. (A) Heatmap showing enrichment of neutrophil subtype gene signatures according to OAC2 and 4 and correlation with blood eosinophils and sputum neutrophil percentages. Boxplots showing enrichment scores (ES) for gene set variation analysis (GSVA) of neutrophil subtypes N1S (B), N1R (C), N2BAL (D) and (N4R (E) in the sputum of OAC2 and OAC4 patients. Adjusted p values are shown. (F) Inverse relationship between sputum neutrophil percentages and tryptophan metabolism in OAC4 (r = −.64, p = .019) but not in other OACs. (G, H) Heatmaps of microbial species showing the increased prevalence of Moraxella catarrhalis in OAC2 compared to OAC4 and a greater reduction of most other species in OAC4 compared to OAC2.

References

    1. Custovic A, Henderson J, Simpson A. Does understanding endotypes translate to better asthma management options for all? J Allergy Clin Immunol. 2019;144(1):25‐33. doi: 10.1016/j.jaci.2019.05.016 Epub May 27 - DOI - PubMed
    1. Holguin F, Cardet JC, Chung KF, et al. Management of severe asthma: a European Respiratory Society/American Thoracic Society guideline. Eur Respir J. 2020;55(1):1900588. doi: 10.1183/13993003.00588-2019 Print 2020 Jan - DOI - PubMed
    1. Papi A, Brightling C, Pedersen SE, Reddel HK. Asthma. Lancet. 2018;391(10122):783‐800. doi: 10.1016/S0140-6736(17)33311-1 Epub 2017 Dec 19 - DOI - PubMed
    1. Pavord I, Bahmer T, Braido F, et al. Severe T2‐high asthma in the biologics era: European experts' opinion. Eur Respir Rev. 2019;28(152):190054. doi: 10.1183/16000617.0054-2019 Print 2019 Jun 30 - DOI - PMC - PubMed
    1. Buhl R, Bel E, Bourdin A, et al. Effective management of severe asthma with biologic medications in adult patients: a literature review and international expert opinion. J Allergy Clin Immunol Pract. 2022;10(2):422‐432. doi: 10.1016/j.jaip.2021.10.059 Epub Nov 8 - DOI - PubMed