. 2024 Oct 4;14(10):1901-1921.
doi: 10.1158/2159-8290.CD-23-1451.

Iron Chelation Therapy Elicits Innate Immune Control of Metastatic Ovarian Cancer

Affiliations

Iron Chelation Therapy Elicits Innate Immune Control of Metastatic Ovarian Cancer

Tito A Sandoval et al. Cancer Discov. .

Abstract

Iron accumulation in tumors contributes to disease progression and chemoresistance. Although targeting this process can influence various hallmarks of cancer, the immunomodulatory effects of iron chelation in the tumor microenvironment are unknown. Here, we report that treatment with deferiprone, an FDA-approved iron chelator, unleashes innate immune responses that restrain ovarian cancer. Deferiprone reprogrammed ovarian cancer cells toward an immunostimulatory state characterized by the production of type-I IFN and overexpression of molecules that activate NK cells. Mechanistically, these effects were driven by innate sensing of mitochondrial DNA in the cytosol and concomitant activation of nuclear DNA damage responses triggered upon iron chelation. Deferiprone synergized with chemotherapy and prolonged the survival of mice with ovarian cancer by bolstering type-I IFN responses that drove NK cell-dependent control of metastatic disease. Hence, iron chelation may represent an alternative immunotherapeutic strategy for malignancies that are refractory to current T-cell-centric modalities. Significance: This study uncovers that targeting dysregulated iron accumulation in ovarian tumors represents a major therapeutic opportunity. Iron chelation therapy using an FDA-approved agent causes immunogenic stress responses in ovarian cancer cells that delay metastatic disease progression and enhance the effects of first-line chemotherapy. See related commentary by Bell and Zou, p. 1771.


Conflict of interest statement

Conflicts of Interests Statement:

J.R.C.-R. holds patents on the use immune modulators for ovarian cancer treatment and serves as scientific consultant for Moderna, Immagene B.V., Autoimmunity Biologic Solutions, Inc., and Emerald Bioventures, LLC. J.R.C.-R also holds stock options in Vescor Therapeutics. D.Z. reports institutional grants from Merck, Genentech, AstraZeneca, Plexxikon, and Synthekine, and personal fees from AstraZeneca, Xencor, Memgen, Takeda, Synthekine, Immunos, Tessa Therapeutics, Miltenyi, and Calidi Biotherapeutics. D.Z. owns a patent on use of oncolytic Newcastle Disease Virus for cancer therapy. L.G. is/has been holding research contracts with Lytix Biopharma, Promontory and Onxeo, has received consulting/advisory honoraria from Boehringer Ingelheim, AstraZeneca, OmniSEQ, Onxeo, The Longevity Labs, Inzen, Imvax, Sotio, Promontory, Noxopharm, EduCom, and the Luke Heller TECPR2 Foundation, and holds Promontory stock options. All other authors declare no potential conflicts of interest.

Figures
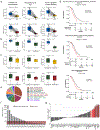
Figure 1.
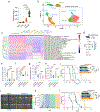
Figure 1.. Status of iron-related gene signatures and factors in human HGSOC.
(a) Expression of iron-related gene signatures in human HGSOC. Box plots indicate the average iron signature scores from scRNA-seq analyses. Epithelial ovarian cancer cells (EOC) are shown in blue, while fibroblasts (Fibro) and immune cells are shown in yellow and red, respectively. Pairwise Wilcoxon tests were conducted, and exact P-values are shown (n = 22 independent specimens). (b) Comparative analysis of iron-related gene signatures in human HGSOC vs. normal fallopian tube samples. Box plots indicate the average iron signature scores from scRNA-seq analyses. EOC are shown in blue (n = 22 independent specimens), normal secretory cells showed in green (n=8 independent specimens). (c) Comparative analysis of the indicated iron-related gene signatures in non-cancerous fallopian tube (n = 8 independent specimens). Unpaired Wilcoxon tests were conducted, and exact P-values are shown (d) Status of the indicated iron-related gene signatures and patient outcome. Survival analysis was based on deconvoluted bulk RNA-seq from TCGA data. Curated human gene sets were used to assess iron-related features. Patients with negative or low expression were compared to those with positive or high expression of signature scores. Survival analysis was performed with Cox proportional hazards model, and results are adjusted for false discovery rate (FDR). (e) Proteomic analysis of cell-free ascites samples obtained from ovarian cancer patients. The percentage distribution of the major proteins is shown. (f) Iron concentration in cell-free ascites. The range of iron concentrations in 6 serum samples from cancer-free donors is depicted in red. Ascites codes represent independent ovarian cancer patients. (g) Correlation of iron content and concentration of diverse soluble factors in patient-derived ascites. Pearson correlation test was conducted in all patients analyzed. Statistically significant correlation coefficients are highlighted in red. Significance levels are marked in the plots (*P <0.05, **P <0.01, ***P <0.001) (n = 23 independent human ascites samples).
Figure 2.
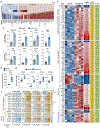
Figure 2.. Iron chelation therapy extends survival in mouse models of ovarian cancer.
(a) Total iron in peritoneal lavage or ascites samples of female mice with ID8-Defb29/Vegfa tumors at different disease stages. (b) Cluster analysis of cells found in the ascites of mice with late-stage metastatic disease. Mice were implanted with ID8-Defb29/Vegfa tumors and after 35 days of tumor progression, the cellular fraction of the ascites was analyzed by scRNA-seq. Unbiased cluster analysis (UMAP projection) of cells (n = 6,502) showing eleven distinct clusters. Ovarian cancer cells are highlighted within the square. (c) Enrichment analysis of iron-related gene signatures in each cluster. Heatmap of single-sample Gene Set Enrichment Analysis (ssGSEA) showing scores for 23 iron-related gene signatures for each cell, grouped by the clusters defined in (b). (d) Schematic representation of treatment regimens. Mice were implanted intraperitoneally with ID8-Defb29/Vegfa or PPNM cancer cells and then treated as indicated. (e-h) Disease features in mice bearing ID8-Defb29/Vegfa tumors analyzed 48 hours after the last treatment (day 30 of tumor progression). (e) Number of peritoneal cancer cells. (f) Volume of ascites recovered. (g) Omentum weight as indicator of tumor burden in this organ. (h) Tumor-induced splenomegaly. Violin plots with individual data points are shown. One-way ANOVA with Tukey’s multiple comparison test was applied, and exact P-values are displayed. (i) Overall survival rates for mice bearing ID8-Defb29/Vegfa tumors. Log-Rank (Mantel-Cox) test was used, and P-values are provided (n = 8). Data are representative of at least three independent experiments with similar results. (j-l) Metastatic progression and survival analysis in mice bearing PPNM-based HGSOC. (j) Bioluminescence imaging (BLI) at day 34. (k) Quantification of peritoneal tumor burden at different time points. (l) Kaplan-Meier survival curves. Log-Rank (Mantel-Cox) test was used, and P-values are shown (n = 9-10 mice/group).
Figure 3.
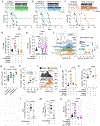
Figure 3.. Treatment with deferiprone elicits NK cell-mediated control of ovarian cancer.
(a-c) Female mice bearing ID8-Defb29/Vegfa tumors were treated as described in Fig. 2d. Peritoneal lavage samples (a) and omental tissue (b and c) were analyzed at day 30 of tumor progression. (a) Representative FACS plots and global violin plots showing the proportion of NK cells in the peritoneal cavity (n = 10/group). (b) Representative images for NKp46 staining in the omentum, scale bar represents 200 μm. (c) NKp46 expression was quantified as the percentage of tissue stained and normalized to total tissue area (n = 4-5 mice/group). (d) Schematic representation of treatment regimens using NK cell-depleting antibodies. (e-g) Kaplan-Meier survival curves for the indicated treatment groups (n = 8-10 mice/group). Median survival and exact P-values for the Log-Rank (Mantel-Cox) test comparing groups treated with isotype vs. NK cell-depleting antibodies are shown. (e-g) Survival curves were derived from the same experiment, but specific comparisons are shown to highlight individual effects. All statistical comparisons are described in Fig S4c.
Figure 4.
Figure 4.. Deferiprone exposure induces innate immune gene programs in ovarian cancer cells.
ID8-Defb29/Vegfa cells were treated with deferiprone or vehicle control for 12 hours, and global transcriptional profiles were analyzed by RNA-seq (n = 4/group). (a) Predicted upstream regulator analysis. (b) Heat maps for differentially expressed genes within the indicated categories showing fold-change (FC), false discovery rate (FDR) and exact P-values. (c-e) Mice bearing ID8-Defb29/Vegfa tumors for 21 days received an intraperitoneal dose of deferiprone or vehicle control, and peritoneal lavage samples were analyzed 24 hours later. (c) Expression of the indicated genes in sorted cancer cells was analyzed by RT-qPCR (n = 5 mice/group). (d) Surface levels of DR5 on cancer cells analyzed by FACS (n = 10 mice/group). (e) Concentration of the indicated factors on cell-free peritoneal lavage samples (n = 5 mice/group). Unpaired Student’s t-test was used to compare vehicle vs deferiprone groups. (f) Patient-derived ovarian cancer organoids were treated with deferiprone for 72 hours and expression of the indicated genes was analyzed by RT-qPCR. Colors indicate log fold-change (FC) upon deferiprone treatment, and this experiment was repeated three independent times with similar results.
Figure 5.
Figure 5.. Innate immune signaling triggered by deferiprone in ovarian cancer cells.
(a and b) ID8-Defb29/Vegfa cells were treated with deferiprone or vehicle control for 6 hours and mitochondrial respiration was assessed thereafter. (a) Representative OCR plots where each time point represents the mean ± SEM. (b) Analysis of the indicated mitochondrial respiration parameters using violin plots with all data points, median, and quartiles (n = 9-10 per condition). (c) Female mice developing metastatic ID8-Defb29/Vegfa tumors for 28 days received one dose of deferiprone (150 mg/Kg) and 8 hours later, tumor cells were sorted from peritoneal lavage. Mitochondrial aconitase activity was measured thereafter (n = 5 independent mice). (d) ID8-Defb29/Vegfa cells were treated with deferiprone (100 μM) for 3 hours. Cytosolic or mitochondrial DNA were simultaneously extracted, and abundance of the indicated genes were analyzed by qPCR (n = 5-7 independent samples). (e) Expression of the indicated genes in deferiprone-exposed ID8-Defb29/Vegfa cells pretreated with the STING inhibitor H-151 (n = 5/condition). Data are representative of at least three independent experiments with similar results. (f) ID8-Defb29/Vegfa cells carrying control non-targeting sgRNA (sgCtrl), or devoid of IRF3 (sgIRF3), were exposed to deferiprone, and expression of the indicated genes was assessed by RT-qPCR (n = 4 per condition). Data are representative of 5 independent sgCtrl and sgIRF3 clones. (g-j) Role of the DDR in deferiprone-induced MULT1 and DR5 on ovarian cancer cells. ID8-Defb29/Vegfa cells were pre-treated for 1 hour with an ATR inhibitor (AZD6738, 1μM), ATM inhibitor (AZD0156, 100nM), or CHK1/2 inhibitor (AZD7762, 300 nM). Then, deferiprone or vehicle was added, and expression of DR5 (g-h) and MULT1 (i-j) was analyzed by FACS 12 hours later (n = 3 technical replicates per condition). Experiments were repeated at least three independent times with similar results. (b-c) violin plots with all data points. (d, e, f, h, j) bar plots with mean ± SEM. (c-d) unpaired Student’s t-test; (b, e, f) one-way ANOVA with Tukey’s multiple comparison test. (h, j) Two-way ANOVA with Šídák’s multiple comparisons test.
Figure 6.
Figure 6.. Deferiprone administration blunts ovarian cancer progression by inducing protective type-I IFN responses.
(a-c) Female mice developing metastatic ID8-Defb29/Vegfa tumors received IFNAR1-blocking or isotype control antibodies, as shown in Fig. S8a, and Kaplan-Meier survival curves were generated for the indicated treatment groups (n = 8-10 mice/group). Median survival and exact P-values for the Log-Rank (Mantel-Cox) test comparing groups treated with isotype or IFNAR1-blocking antibodies are shown. (d) Female mice bearing advanced ID8-Defb29/Vegfa tumors were treated as indicated in Fig. S8c, and NK cell proportions in the peritoneal cavity were analyzed thereafter (n = 10 mice/group). (e) sgCtrl or sgIRF3 ID8-Defb29/Vegfa cells were implanted into female mice and treated as described in Fig. S8e, and NK cell proportions in the peritoneal cavity were analyzed thereafter (n = 9-10 mice/group). (f-h) IL-152A-eGFP female developing ID8-Defb29/Vegfa tumors were treated as described in Fig. S8g (n = 9-10 mice/group). (f) Representative histograms and violin plots of eGFP/IL-15 expression in tDCs from peritoneal lavage samples. (g) Percent of tDCs exhibiting high levels of IL-15. (h) Correlation between IFN-β concentration and eGFP/IL-15 expression in tDCs (n = 3-5 mice/group). (i-k) IL-152A-eGFP female mice bearing ID8-Defb29/Vegfa tumors were treated as described in Fig. S8c. (i) Representative histograms of eGFP/IL-15 expression in tDCs from peritoneal lavage samples for the indicated groups. (j) Violin plots showing the gMFI of eGFP/IL-15 signal in tDCs of the indicated groups. (k) Percent of tDCs exhibiting high levels of IL-15 (n = 4-5 mice/group). (l-m) Itgax-DTR-GFP female mice implanted with ID8-Defb29/Vegfa tumors were treated as described in Fig. S8j. The proportion of (l) tDCs and (m) NK cells in the peritoneal cavity were analyzed by FACS (n = 6-10 mice/group) (n) Female mice developing metastatic ID8-Defb29/Vegfa tumors were treated as shown in Fig. S8n, and the percentage of NK cells was assessed by FACS. (d, e, f, g, j, k and n) One-way ANOVA with Tukey’s multiple comparison test. (l-m) unpaired Student’s t-test (h) Pearson correlation coefficient (r2) and exact P-value for all the significant comparisons.
Figure 7.
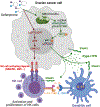
Figure 7.. Proposed Model.
Deferiprone exposure instigates two parallel innate immunostimulatory mechanisms in ovarian cancer cells: it triggers the DDR through ATR-CHK1/2 activation, bolstering surface expression of NK cell-activating molecules such as DR5 and MULT1. Concurrently, the drug disrupts mitochondrial integrity, leading to the release of mtDNA that induces type I IFN via the cGAS-STING-IRF3 axis. Increased type-I IFN levels within the metastatic ovarian cancer microenvironment enhances IL-15 expression by tDCs that promotes NK cell accumulation and function at tumor sites. (Created with BioRender.com)

References

    1. Hentze MW, Muckenthaler MU, Galy B, Camaschella C. Two to tango: regulation of Mammalian iron metabolism. Cell 2010;142(1):24–38 doi 10.1016/j.cell.2010.06.028. - DOI - PubMed
    1. Crielaard BJ, Lammers T, Rivella S. Targeting iron metabolism in drug discovery and delivery. Nat Rev Drug Discov 2017;16(6):400–23 doi 10.1038/nrd.2016.248. - DOI - PMC - PubMed
    1. Wang Y, Yu L, Ding J, Chen Y. Iron Metabolism in Cancer. Int J Mol Sci 2018;20(1) doi 10.3390/ijms20010095. - DOI - PMC - PubMed
    1. Torti SV, Torti FM. Iron and cancer: more ore to be mined. Nat Rev Cancer 2013;13(5):342–55 doi 10.1038/nrc3495. - DOI - PMC - PubMed
    1. Torti SV, Manz DH, Paul BT, Blanchette-Farra N, Torti FM. Iron and Cancer. Annu Rev Nutr 2018;38:97–125 doi 10.1146/annurev-nutr-082117-051732. - DOI - PMC - PubMed