. 2024 Jul 29;40(1):60.
doi: 10.1007/s10565-024-09903-3.

Proteasome activity inhibition mediates endoplasmic reticulum stress-apoptosis in triptolide/lipopolysaccharide-induced hepatotoxicity

Affiliations

Proteasome activity inhibition mediates endoplasmic reticulum stress-apoptosis in triptolide/lipopolysaccharide-induced hepatotoxicity

Ruohan Cheng et al. Cell Biol Toxicol. .

Abstract

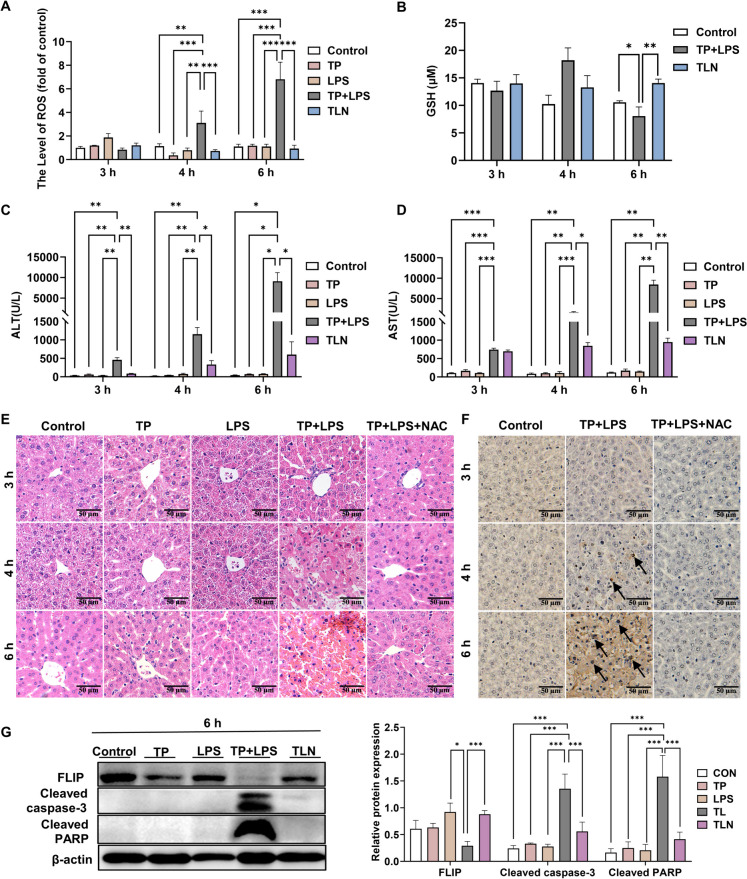
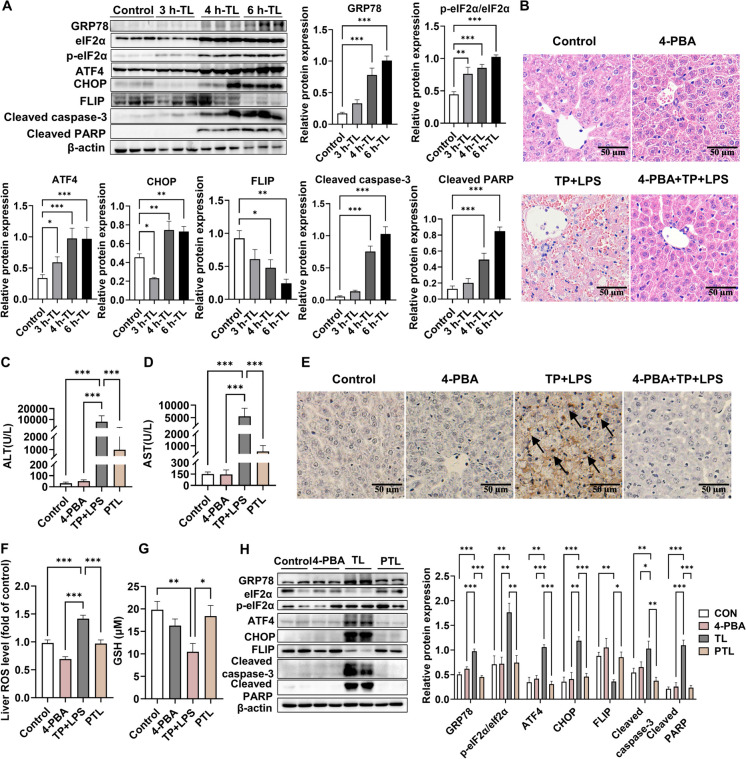
Triptolide (TP) is a major active and toxic composition of the Chinese medicine Tripterygium wilfordii Hook. F. (TWHF), exhibiting various therapeutic bioactivities. Among the toxic effects, the hepatotoxicity of TP deserves serious attention. Previously, our research group proposed a new view of TP-related hepatotoxicity: hepatic hypersensitivity under lipopolysaccharide (LPS) stimulation. However, the mechanism of TP/LPS-induced hepatic hypersensitivity remains unclear. In this study, we investigated the mechanism underlying TP/LPS-induced hypersensitivity from the perspective of the inhibition of proteasome activity, activated endoplasmic reticulum stress (ERS)-related apoptosis, and the accumulation of reactive oxygen species (ROS). Our results showed that N-acetylcysteine (NAC), a common ROS inhibitor, decreased the expression of cleaved caspase-3 and cleaved PARP, which are associated with FLIP enhancement. Moreover, 4-phenylbutyric acid (4-PBA), an ERS inhibitor, was able to alleviate TP/LPS-induced hepatotoxicity by reducing ERS-related apoptosis protein expression (GRP78, p-eIF2α/eIF2α, ATF4, CHOP, cleaved caspase-3 and cleaved PARP) and ROS levels, with ATF4 being an indispensable mediator. In addition, the proteasome activity inhibitor MG-132 further aggravated ERS-related apoptosis, which indicated that the inhibition of proteasome activity also plays an important role in TP/LPS-related liver injuries. In summary, we propose that TP/LPS may upregulate the activation of ERS-associated apoptosis by inhibiting proteasome activity and enhancing ROS production through ATF4.

Keywords: Apoptosis; Endoplasmic reticulum stress; Proteasome activity; Reactive oxygen species; Triptolide.


Conflict of interest statement

The authors declare no competing interests.

Figures

Fig. 1
Fig. 1
TP/LPS activated the ROS-dependent apoptotic pathway. (A) ROS levels in mice at different times. (B) GSH levels in mice at different time points. (C-D) Serum ALT and AST in mice treated with TP, LPS, NAC or both at different times. (E) H&E-staining images of mice liver tissue Sects. (400 × , Scale bar = 20 μm). (F) TUNEL staining images of mice liver tissue Sects. (200 × , Scale bar = 50 μm). (G) At 6 h, representative illustrative Western blot images and corresponding relative intensities of the protein bands of apoptosis-related proteins, with β-actin acting as the loading control. The results are presented in the form of means ± SEMs. *P < 0.05, **P < 0.01, ***P < 0.001, n = 6
Fig. 2
Fig. 2
Effects of 4-PBA administration on hepatotoxicity triggered by TP/LPS cotreatment. (A) Representative illustrative Western blot images at different times and the relative intensity of the protein bands concerning ERS-related and apoptosis-related proteins, with β-actin acting as the loading control. (B) H&E-staining images of mice liver tissue Sects. (400 × , Scale bar = 20 μm). (C-D) Alterations in the blood biochemical parameters (serum ALT and AST) of the mice. (E) TUNEL staining images of mice liver tissue Sects. (200 × , Scale bar = 50 μm). (F-G) Effect of 4-PBA preadministration on ROS and GSH levels in liver tissues. (H) Representative illustrative Western blot images and relative intensities of protein bands corresponding to the GRP78-ATF4-CHOP signaling pathway and cleaved caspase-3, cleaved PARP, and FLIP in vivo normalized to that of β-actin. The results are presented in the form of the means ± SEMs. *P < 0.05, **P < 0.01, ***P < 0.001, n = 6
Fig. 3
Fig. 3
Effects of 4-PBA administration on hepatotoxicity induced by TP/TNF-α cotreatment. (A-B) The optimal dose of 4-PBA was confirmed with a CCK-8 assay. (C) Schematic representation of the experimental procedure. (D-E) AML12 cells were treated with 4-PBA (2.5 mM) plus TP (50 nM)/TNF-α (50 ng/mL) and were collected at 24 h after TNF-α administration for LDH and immunofluorescence assays, respectively. (F) Representative illustrative Western blot images and relative intensities of the protein bands concerning eIF2α, p-eIF2α, CHOP, FLIP, cleaved caspase-3 and cleaved PARP, with β-actin acting as the loading control. The results are presented in the form of the means ± SEMs. *P < 0.05, **P < 0.01, ***P < 0.001, n = 3
Fig. 4
Fig. 4
Interference with ATF4 alleviated cell apoptosis by inhibiting ROS accumulation. (A) Verification of the knockdown efficiency of ATF4 in AML12 cells. (B) Relative LDH leakage of AML12 cells treated with si-NC or si-ATF4 plus TP/TNF-α for 24 h. (C-D) Treated AML12 cells were collected at 24 h after TNF-α administration. Representative illustrative Western blot images and relative intensities of the protein bands of ATF4, CHOP, cleaved caspase-3, and cleaved PARP are shown, with GAPDH acting as the loading control. (E) Treated AML12 cells were collected at 24 h after TNF-α treatment, and ROS levels were detected by DCFH-DA. (F) Treated AML12 cells were collected at 2, 3, 12 and 24 h after TNF-α administration for ROS detection by DCFH-DA. (G) AML12 cells were treated with 4-PBA (2.5 mM) plus TP/TNF-α and were collected 3 h and 24 h after TNF-α application for ROS detection by DCFH-DA. (H-I) Treated AML12 cells were collected 3 h and 24 h after TNF-α treatment to detect ROS levels. (J) AML12 cells were treated with 4-PBA plus TP/TNF-α and collected 2 h after TNF-α treatment for detection of ATF4 expression. (K-L) AML12 cells were treated with 4-PBA or BHA (100 μM) plus TP/TNF-α and were at collected 3 h after TNF-α administration for detection of ATF4 expression. The results are presented in the form of the means ± SEMs. *P < 0.05, **P < 0.01, ***P < 0.001, n = 3
Fig. 5
Fig. 5
Inhibition of proteasome activity was responsible for the production of ERS induced via TP/LPS or TP/TNF-α cotreatment. (A) Changes in liver proteasome activity in vivo at 6 h after LPS administration (n = 6). (B) Changes in proteasome activity in AML12 cells treated with TP/TNF-α were assessed at 1, 1.5, 2 and 24 h after TNF-α administration. (C) Changes in liver proteasome activity within AML12 cells treated with different concentrations of MG-132. (D) AML12 cells from different groups were collected, and ROS levels were detected with CellROX Green Reagent. (E) AML12 cells were treated with 5, 10 or 20 μM MG-132 for 24 h and collected. The protein levels of GRP78, eIF2α, p-eIF2α, ATF4, CHOP, cleaved caspase-3, and cleaved PARP in vitro were determined by western blot analysis and normalized to that of β-actin. (F) AML12 cells were treated with 4-PBA (2.5 mM), MG-132 (10 μM) or both for 24 h and were collected. The representative illustrative Western blot images and relative intensities of the FLIP, cleaved caspase-3 and cleaved PARP protein bands are shown, with β-actin serving as the loading control (n = 3). (G) Alterations in proteasome activity in AML12 cells in different groups. (H-I) LDH and CCK8 assays for detecting the cytotoxicity of different groups of AML12 cells. (J) AML12 cells treated with TP, TNF-α, MG-132 or both were collected 24 h after MG-132 treatment. Representative illustrative Western blot images and relative intensities of the FLIP, CHOP, and cleaved caspase-3 protein bands and of the cleaved PARP band, with β-actin acting as the loading control. The results are presented in the form of the means ± SEMs. *P < 0.05, **P < 0.01, ***P < 0.001, n = 3

References

    1. Area-Gomez E, Schon EA. Mitochondria-associated ER membranes and Alzheimer disease. Curr Opin Genet Dev. 2016. 10.1016/j.gde.2016.04.006. - PMC - PubMed
    1. Aufschnaiter A, Kohler V, Diessl J, et al. Mitochondrial lipids in neurodegeneration. Cell Tissue Res. 2017. 10.1007/s00441-016-2463-1. - PMC - PubMed
    1. Bertheloot D, Latz E, Franklin BS. Necroptosis, pyroptosis and apoptosis: an intricate game of cell death. Cell Mol Immunol. 2021. 10.1038/s41423-020-00630-3. - PMC - PubMed
    1. Chen J, Wu H, Tang X, et al. 4-Phenylbutyrate protects against rifampin-induced liver injury via regulating MRP2 ubiquitination through inhibiting endoplasmic reticulum stress. Bioengineered. 2022. 10.1080/21655979.2021.2024970. - PMC - PubMed
    1. Ciechanover A, Kwon YT. Degradation of misfolded proteins in neurodegenerative diseases: therapeutic targets and strategies. Exp Mol Med. 2015. 10.1038/emm.2014.117. - PMC - PubMed

Publication types

MeSH terms

LinkOut - more resources