Observational Study
. 2024 Nov 25;120(14):1752-1767.
doi: 10.1093/cvr/cvae159.

Coronavirus disease 2019-related myocardial injury is associated with immune dysregulation in symptomatic patients with cardiac magnetic resonance imaging abnormalities

Affiliations
Observational Study

Coronavirus disease 2019-related myocardial injury is associated with immune dysregulation in symptomatic patients with cardiac magnetic resonance imaging abnormalities

Andrej Ćorović et al. Cardiovasc Res. .

Abstract

Aims: While acute cardiovascular complications of coronavirus disease 2019 (COVID-19) are well described, less is known about longer-term cardiac sequelae. For many individuals with cardiac signs or symptoms arising after COVID-19 infection, the aetiology remains unclear. We examined immune profiles associated with magnetic resonance imaging (MRI) abnormalities in patients with unexplained cardiac injury after COVID-19.

Methods and results: Twenty-one participants {mean age 47 [standard deviation (SD) 13] years, 71% female} with long COVID-19 (n = 17), raised troponin (n = 2), or unexplained new-onset heart failure (n = 2), who did not have pre-existing heart conditions or recent steroid/immunosuppression treatment, were enrolled a mean 346 (SD 191) days after COVID-19 infection in a prospective observational study. Cardiac MRI and blood sampling for deep immunophenotyping using mass cytometry by time of flight and measurement of proteomic inflammatory markers were performed. Nine of the 21 (43%) participants had MRI abnormalities (MRI(+)), including non-ischaemic patterns of late gadolinium enhancement and/or visually overt myocardial oedema in 8 people. One patient had mildly impaired biventricular function without fibrosis or oedema, and two had severe left ventricular (LV) impairment. MRI(+) individuals had higher blood CCL3, CCL7, FGF-23, and CD4 Th2 cells, and lower CD8 T effector memory (TEM) cells, than MRI(-). Cluster analysis revealed lower expression of inhibitory receptors PD1 and TIM3 in CD8 TEM cells from MRI(+) patients than MRI(-) patients, and functional studies of CD8 T αβ cells showed higher proportions of cytotoxic granzyme B+(GZB+)-secreting cells upon stimulation. CD8 TEM cells and CCL7 were the strongest predictors of MRI abnormalities in a least absolute shrinkage and selection operator regression model (composite area under the curve 0.96, 95% confidence interval 0.88-1.0). CCL7 was correlated with diffuse myocardial fibrosis/oedema detected by quantitative T1 mapping (r = 0.47, P = 0.04).

Conclusion: COVID-19-related cardiac injury in symptomatic patients with non-ischaemic myocarditis-like MRI abnormalities is associated with immune dysregulation, including decreased peripheral CD8 TEM cells and increased CCL7, persisting long after the initial infection.

Trial registration: ClinicalTrials.gov NCT04412369.

Keywords: COVID-19; Immunophenotyping; Magnetic resonance imaging; Myocarditis.


Conflict of interest statement

Conflict of interest: none declared.

Figures

Graphical Abstract
Graphical Abstract
Summary of study methods and main findings.
Figure 1
Figure 1
Cardiac MRI abnormalities in patients after COVID-19. Representative images showing cardiac MRI abnormalities (arrows) detected in patients after COVID-19 infection: (A) increased T2-weighted oedema signal in the mid-anterolateral segment; (B) linear mid-wall LGE in the basal septum; and a (C) small focus of basal anterior sub-endocardial LGE in a patient with (D) no epicardial coronary artery disease on CTA. Scale bar = 20 mm.
Figure 2
Figure 2
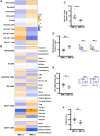
Deep immune cell phenotyping in patients stratified by cardiac MRI. (A and B) Heatmaps comparing circulating immune cell subsets in patients (n = 19) with (+) and without (−) cardiac MRI abnormalities. Transformed data displayed in heatmaps compared using Student's t test. Scatter dot plots with representative flow cytometry graphs showing proportions of (C) CD8 αβ T cells, (D) CD4 Th2-like cells, and (E) CD8 TEM and (F) CD8 PD1+ TEM cells in patients (n = 19) with (+) and without (−) MRI abnormalities compared using Student's t test; *P < 0.05; **P < 0.01; ***P < 0.001.
Figure 3
Figure 3
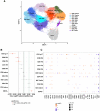
CyTOF cluster analysis for deep immunophenotyping of patients stratified by cardiac MRI. (A) UMAP and (B) metaplot showing differences in the proportions of cell types from 97013 cells in MRI(+) and MRI(−) patients (n = 19) using ‘flowCore’ and Seurat analysis packages. (C) Dotplot of average log2 fold change for differential expression of all markers in each cell subset in MRI(+) vs. MRI(−) patients (n = 19) using Seurat ‘FindMarkers’ function with ‘Wilcox’ test and selected markers (adj.P < 0.05). The dot size represents the significance level, with orange/blue colour scale representing up/down expression for MRI(+) vs. MRI(−), respectively.
Figure 4
Figure 4
CyTOF re-clustering analysis for CD4/CD8 T cell subsets in patients stratified by cardiac MRI. (A) UMAP and (B) metaplot showing differences in the proportions of cell types from 97 013 cells in MRI(+) and MRI(−) patients (n = 19) using ‘flowCore’ and Seurat analysis packages. (C) Dotplot of average log2 fold change for differential expression of all markers in each cell subset in MRI(+) vs. MRI(−) patients (n = 19) using Seurat ‘FindMarkers’ function with ‘Wilcox’ test and selected markers (adj.P < 0.05). The dot size represents the significance level, with orange/blue colour scale representing up/down expression for MRI(+) vs. MRI(−), respectively.
Figure 5
Figure 5
Characterization of CD8 T cells and CD14 monocytes in patients stratified by cardiac MRI. Scatter dot plots comparing proportions of T cells secreting/expressing (A) IFNγ, (B) GZB, (C) CTLA4, and (D) PD1 and (E) TNF-α secreting CD14 monocytes in MRI(+) and MRI(−) patients (n = 20) after stimulation with Leukocyte Activator Cocktail + Golgi Plug compared using Student's t test. *P < 0.05; **P < 0.01.
Figure 6
Figure 6
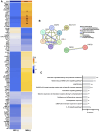
Proteomic inflammatory markers in patients stratified by cardiac MRI. (A) Heatmap comparing proteomic inflammatory mediators in patients (n = 20) with (+) and without (−) cardiac MRI abnormalities. Transformed data compared using Student's t test. (B) Functional protein interaction network identified by STRING pathway analysis for the nine differentially expressed proteins (N.B. ST1A1 = SULT1A1; CD274 = PDL1) and (C) graph showing selected significantly enriched gene set enrichment analysis pathways. Each bar represents the number of significantly expressed proteins per pathway compared using Fisher's exact test. *P < 0.05; **P < 0.01; ***P < 0.001.
Figure 7
Figure 7
Immune features associated with cardiac MRI abnormalities. (A) Volcano plot showing immune features that differed (P < 0.05) between participants (n = 18) with (+) and without (−) abnormal cardiac MRI findings compared using Student's t test; (B and C) principal component analysis plots showing clustering of candidate features with P < 0.1 and the separation of patients (n = 18) with MRI(+) and MRI(−) scans based on these features; (D) ROC plot showing the AUC for the two strongest predictors of MRI abnormalities (CCL7 and CD8 TEM) identified in the LASSO regression analysis (n = 18 patients); (E) correlation matrix showing Pearson correlations between the 12 candidate immune markers that differed (P < 0.05) between patients (n = 18) with (+) and without (−) MRI abnormalities, plus quantitative T1/T2 mapping values on MRI. The colour intensity and size of the circles are proportional to the absolute values of the correlation coefficients. *P < 0.05; **P < 0.01.

References

    1. Giacca M, Shah AM. The pathological maelstrom of COVID-19 and cardiovascular disease. Nat Cardiovasc Res 2022;1:200–210. - PubMed
    1. Shi S, Qin M, Shen B, Cai Y, Liu T, Yang F, Gong W, Liu X, Liang J, Zhao Q, Huang H, Yabg B, Huang C. Association of cardiac injury with mortality in hospitalized patients with COVID-19 in Wuhan, China. JAMA Cardiol 2020;5:802–810. - PMC - PubMed
    1. Chen T, Wu D, Chen H, Yan W, Yang D, Chen G, Ma K, Xu D, Yu H, Wang H, Wang T, Guo W, Chen J, Ding C, Zhang X, Huang J, Han M, Li S, Luo X, Zhao J, Ning Q. Clinical characteristics of 113 deceased patients with coronavirus disease 2019: retrospective study. BMJ 2020;368:m1091. - PMC - PubMed
    1. Guo T, Fan Y, Chen M, Wu X, Zhang L, He T, Wang H, Wan J, Wang X, Lu Z. Cardiovascular implications of fatal outcomes of patients with coronavirus disease 2019 (COVID-19). JAMA Cardiol 2020;5:811–818. - PMC - PubMed
    1. Zhou F, Yu T, Du R, Fan G, Liu Y, Liu Z, Xiang J, Wang Y, Song B, Gu X, Guan L, Wei Y, Li H, Wu X, Xu J, Tu S, Zhang Y, Chen H, Cao B. Clinical course and risk factors for mortality of adult inpatients with COVID-19 in Wuhan, China: a retrospective cohort study. Lancet 2020;395:1054–1062. - PMC - PubMed

Publication types

Associated data