. 2024 Jul 29;20(7):e1011357.
doi: 10.1371/journal.pgen.1011357. eCollection 2024 Jul.

Spermatogenic cell-specific type 1 hexokinase (HK1S) is essential for capacitation-associated increase in tyrosine phosphorylation and male fertility in mice

Affiliations

Spermatogenic cell-specific type 1 hexokinase (HK1S) is essential for capacitation-associated increase in tyrosine phosphorylation and male fertility in mice

Yingchao Tian et al. PLoS Genet. .

Abstract

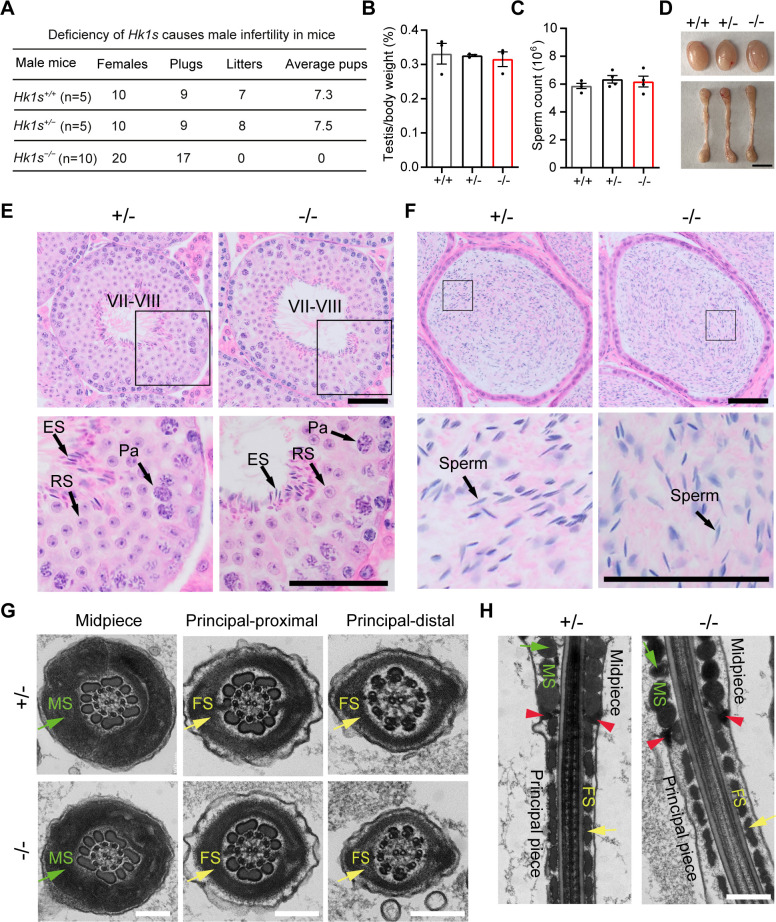
Hexokinase (HK) catalyzes the first irreversible rate-limiting step in glycolysis that converts glucose to glucose-6-phosphate. HK1 is ubiquitously expressed in the brain, erythrocytes, and other tissues where glycolysis serves as the major source of ATP production. Spermatogenic cell-specific type 1 hexokinase (HK1S) is expressed in sperm but its physiological role in male mice is still unknown. In this study, we generate Hk1s knockout mice using the CRISPR/Cas9 system to study the gene function in vivo. Hk1s mRNA is exclusively expressed in testes starting from postnatal day 18 and continuing to adulthood. HK1S protein is specifically localized in the outer surface of the sperm fibrous sheath (FS). Depletion of Hk1s leads to infertility in male mice and reduces sperm glycolytic pathway activity, yet they have normal motile parameters and ATP levels. In addition, by using in vitro fertilization (IVF), Hk1s deficient sperms are unable to fertilize cumulus-intact or cumulus-free oocytes, but can normally fertilize zona pellucida-free oocytes. Moreover, Hk1s deficiency impairs sperm migration into the oviduct, reduces acrosome reaction, and prevents capacitation-associated increases in tyrosine phosphorylation, which are probable causes of infertility. Taken together, our results reveal that HK1S plays a critical role in sperm function and male fertility in mice.


Conflict of interest statement

The authors have declared that no competing interests exist.

Figures

Fig 1
Fig 1. Expression pattern of Hk1s in mice and generation of Hk1s−/− mice.
(A) qRT-PCR analysis of transcript levels of members of the HK gene family in mouse sperm. Mice number (n = 3). (B) qRT-PCR analysis of Hk1s mRNA levels in various organs of adult mice. Mice number (n = 3). (C) qRT-PCR analysis of Hk1s mRNA levels in mouse testes of indicated ages. Mice number (n = 3). (D) Schematic diagram showing the gene structure of Hk1s and the CRISPR/Cas9 system used to generate the knockout allele. The upper panel shows the region of the Hk1s locus that was targeted. Two gRNAs were used to achieve deletion of the SSR genomic fragment (6399bp). The frameshift-mutated sequences of the knockout allele and Sanger sequencing are shown in the middle and lower panels. The locations of the gRNAs and primers (F1, R1, and R2) are indicated. (E) Genotyping of Hk1s/ mice by primers indicated in (D); the sizes of PCR products are shown on the left. (F) qRT-PCR analysis of Hk1s mRNA levels in Hk1s+/ and Hk1s/ sperm. Mice number (n = 3) per genotype. Error bars: SEM. Statistics, Student’s t-Test. ***, P < 0.001. (G) Western blot analysis of HK1 and HK1S protein levels in Hk1s+/ and Hk1s/ brain and sperm. α-Tubulin was used as a loading control.
Fig 2
Fig 2. HK1S is localized to the outside of FS.
(A) Immunostaining analysis of HK1 and HK1S in Hk1s+/ and Hk1s/ testis sections. The white boxes indicate that HK1S was highly expressed or successfully deleted in the sperm flagella. Arrows indicate nonspecific signaling. Spermatid (S). HK1 and HK1S (red); PNA (green), as the marker of sperm acrosome; DAPI nuclear counterstaining of DNA (blue). Scale bar: 10 μm. (B) Immunostaining analysis of HK1S in Hk1s+/ and Hk1s/ sperm. HK1S (red); MitoTracker staining (white), as the maker for mitochondrial sheath; PNA (green); DAPI (blue). Scale bar: 10 μm. (C) Western blot analysis of Hk1s+/ and Hk1s/ sperm fractionated into Triton X-100 soluble, SDS-soluble, and SDS-resistant insoluble fractions. Basigin, acetylated Tubulin, and AKAP4 were used as makers for Triton-soluble, SDS-soluble, and SDS-resistant fractions, respectively. (D) IEM images of HK1S in the ultrathin sections of mouse sperm. Arrows indicate HK1S gold particles. Fibrous sheath (FS). Scale bars: 100 nm.
Fig 3
Fig 3. Hk1s−/− male mice are infertile but have normal sperm morphology.
(A) Number of litters born per plug detected. (B) Ratios of testis weight to body weight of Hk1s+/+, Hk1s+/ and Hk1s/ mice. Mice number (n = 3) per genotype. (C) The number of sperm in cauda epididymides of Hk1s+/+, Hk1s+/ or Hk1s/ male mice was counted and analyzed. Mice number (n = 4) per genotype. (D) Representative images showing the morphology of testes and epididymides in adult Hk1s+/+, Hk1s+/, or Hk1s/ mice. Scale bars: 5 mm. (E) H&E staining in testis sections of Hk1s+/ and Hk1s/ mice. Pa, pachytene; Rs, round spermatids; ES, elongated spermatids. Scale bars: 50 μm. (F) H&E staining in cauda epididymis sections of Hk1s+/ and Hk1s/ mice. Scale bars: 50 μm. (G) Ultrastructural analysis of cross-section of sperm from the cauda epididymis obtained from Hk1s+/ and Hk1s/ mice using TEM. MS, mitochondrial sheath (green arrow); FS, fibrous sheath (yellow arrow). Scale bars: 200 nm. (H) Ultrastructural analysis of longitudinal section near the annulus of sperm from the cauda epididymis obtained from Hk1s+/ and Hk1s/ mice using TEM. MS, mitochondrial sheath (green arrow); FS, fibrous sheath (yellow arrow); Red arrowheads indicate the sperm annulus. Scale bars: 500 nm.
Fig 4
Fig 4. Hk1s deficiency reduces sperm glycolytic metabolism but does not affect sperm motility and ATP levels.
(A-B) A CASA system was used to measure sperm motility parameters for 10 min (non-capacitated condition, Non-cap) and 2 h (capacitated condition, Cap) in TYH medium. PR, progressive motility; VAP, average path velocity; VSL, straight line velocity; VCL, curvilinear velocity; ALH, amplitude of lateral head displacement; BCF, beat cross frequency; STR, straightness; LIN, Linearity. Mice number (n = 3) per genotype. Error bars: SEM. Statistics, Student’s t-Test. ns: non-significant. (C-D) Changes of glycolysis and TAC metabolites in the capacitated Hk1s/ sperm compared with control by LC-MS-based targeted metabolomics analysis. Mice number (n = 3–6) per genotype. Error bars: SEM. Statistics, Student’s t-Test. ***, P < 0.001; ns: non-significant. (E) Sperm ATP levels in the capacitated Hk1s/ sperm compared with control by LC-MS-based targeted metabolomics analysis. Mice number (n = 4) per genotype. Error bars: SEM. Statistics, Student’s t-Test. ns: non-significant.
Fig 5
Fig 5. In vitro fertility of Hk1s−/− male mice.
(A) Representative images of IVF with cumulus-intact oocytes. Oocytes were collected from oviducts of wild-type female and co-cultured with Hk1s+/ and Hk1s/ sperm for 24 h. Scale bar: 100 μm. Arrow indicates 2-cells. (B) Development of 2-cell, 4-cell, and blastula embryo ratio of IVF with cumulus-intact oocytes between Hk1s+/ and Hk1s/ groups. Mice number (n = 3) per genotype. Error bars: SEM. Statistics, Student’s t-Test. ***, P < 0.001. (C) Representative images of IVF with cumulus-free oocytes. Scale bar: 100 μm. Arrow indicates 2-cell. (D) Development of 2-cell, 4-cell, and blastula embryo ratio of IVF with cumulus-free oocytes between Hk1s+/ and Hk1s/ groups. Mice number (n = 3) per genotype. Error bars: SEM. Statistics, Student’s t-Test. ***, P < 0.001. (E) Representative images of IVF with ZP-free oocytes. Scale bar: 100 μm. Arrows indicate 2-cells. (F) Development of 2-cell, 4-cell, and blastula embryo ratio of IVF with ZP-free oocytes between Hk1s+/ and Hk1s/ groups. Mice number (n = 3) per genotype. Error bars: SEM. Statistics, Student’s t-Test. ns: non-significant.
Fig 6
Fig 6. Disruption of Hk1s affects the sperm migration into oviduct and reduces acrosome reaction.
(A) H&E staining showed the migration of sperm from uterus into oviducts. Uterus, colliculus of the UTJ, and sperm ejaculated into uterus are shown in the middle panels. Left and right panel insets show higher magnification. Arrows show sperm. More than three females plugged by a male of each genotype were detected and representative images are shown. Left and right bar: 20 μm, middle bar: 200 μm. (B) Sperm number in the bilateral oviducts of plugged females were counted and analyzed. Mice number (n = 5–6) per genotype. Error bars: SEM. Statistics, Student’s t-Test. ***, P < 0.001. (C) Non-AR and AR sperm were stained by Coomassie Brilliant Blue R-250, and acrosome disappeared in the AR sperm. Black arrowheads indicate the disappeared acrosome; Red arrowheads indicate the intact acrosome. Scale bar: 20 μm. (D) The percentage of the AR in Hk1s+/ and Hk1s/ sperm, which was incubated after 10 min, 30 min, 60 min in the capacitating medium. Calcium ionophore A23187 was added to induce the AR for 60 min. Mice number (n = 3) per genotype. Error bars: SEM. Statistics, Student’s t-Test. **, P < 0.01; ns: non-significant. (E) The percentage of the AR was induced by progesterone (P4) in capacitated Hk1s+/ and Hk1s/ sperm. Mice number (n = 3) per genotype. Error bars: SEM. Statistics, Student’s t-Test. **, P < 0.01.
Fig 7
Fig 7. HK1S is required for protein tyrosine phosphorylation associated with sperm capacitation.
(A) Western blot analysis for phosphotyrosine (pTyr) of Hk1s+/ and Hk1s/ sperm under non-capacitating (Non-cap) and capacitating (Cap) medium for 60 min. α-Tubulin was used as a loading control. Arrow indicates HK1S, which was a tyrosine phosphorylated form. (B) The quantification of protein pTyr level in Hk1s+/ and Hk1s/ sperm under non-capacitation (Non-cap) and capacitation (Cap) medium for 60 min. Mice number (n = 3) per genotype. Error bars: SEM. Statistics, Student’s t-Test. **, P < 0.01; ns: non-significant. (C) Western blot analysis for pTyr of Hk1s+/ and Hk1s/ sperm under capacitating medium ±1 mM dbcAMP and 100 μM IBMX for 60 min. α-Tubulin was used as a loading control. Arrow indicates HK1S. (D) The quantification of protein pTyr level in Hk1s+/ and Hk1s/ sperm under capacitating medium ±1 mM dbcAMP and 100 μM IBMX for 60 min. Mice number (n = 3) per genotype. Error bars: SEM. Statistics, Student’s t-Test. **, P < 0.01; ns: non-significant.

References

    1. Austin CR, Bishop MW. Capacitation of mammalian spermatozoa. Nature. 1958;181(4612):851. doi: 10.1038/181851a0 . - DOI - PubMed
    1. Ferreira JJ, Cassina A, Irigoyen P, Ford M, Pietroroia S, Peramsetty N, et al.. Increased mitochondrial activity upon CatSper channel activation is required for mouse sperm capacitation. Redox Biol. 2021;48:102176. doi: 10.1016/j.redox.2021.102176 . - DOI - PMC - PubMed
    1. Okabe M. The cell biology of mammalian fertilization. Development. 2013;140(22):4471–9. doi: 10.1242/dev.090613 . - DOI - PubMed
    1. De Jesus A, Keyhani-Nejad F, Pusec CM, Goodman L, Geier JA, Stoolman JS, et al.. Hexokinase 1 cellular localization regulates the metabolic fate of glucose. Mol Cell. 2022;82(7):1261–77 e9. doi: 10.1016/j.molcel.2022.02.028 . - DOI - PMC - PubMed
    1. Puleston DJ, Villa M, Pearce EL. Ancillary Activity: Beyond Core Metabolism in Immune Cells. Cell Metab. 2017;26(1):131–41. doi: 10.1016/j.cmet.2017.06.019 . - DOI - PMC - PubMed