. 2024 Aug 6;121(32):e2404770121.
doi: 10.1073/pnas.2404770121. Epub 2024 Jul 29.

The RPD3L deacetylation complex is required for facultative heterochromatin repression in Neurospora crassa

Affiliations

The RPD3L deacetylation complex is required for facultative heterochromatin repression in Neurospora crassa

Colleen C Mumford et al. Proc Natl Acad Sci U S A. .

Abstract

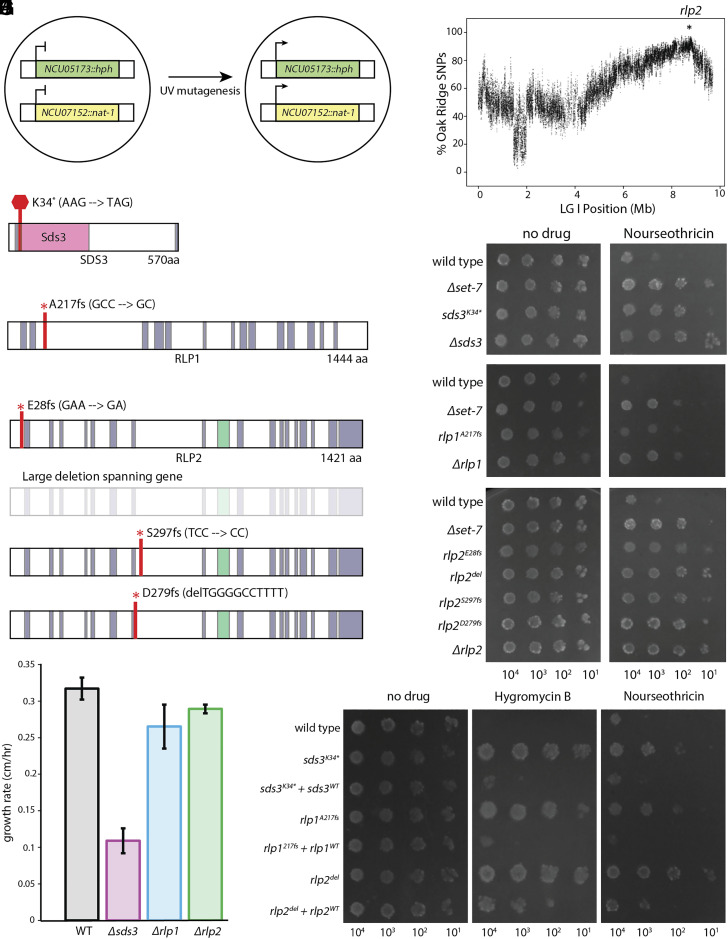
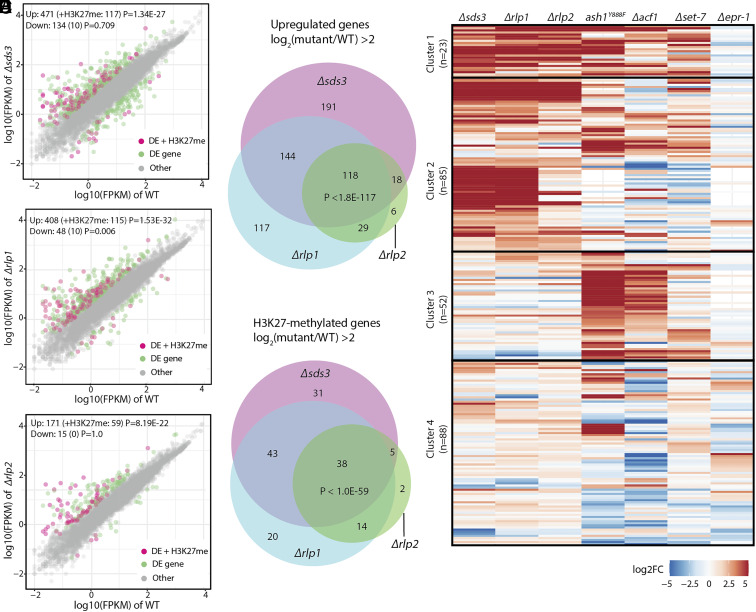
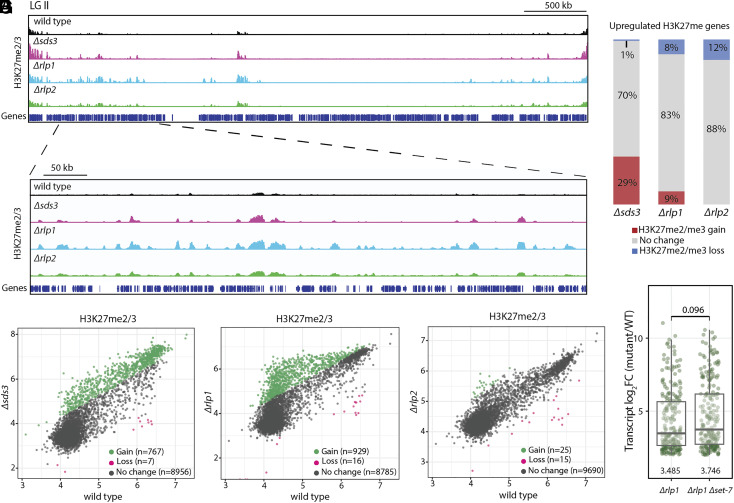
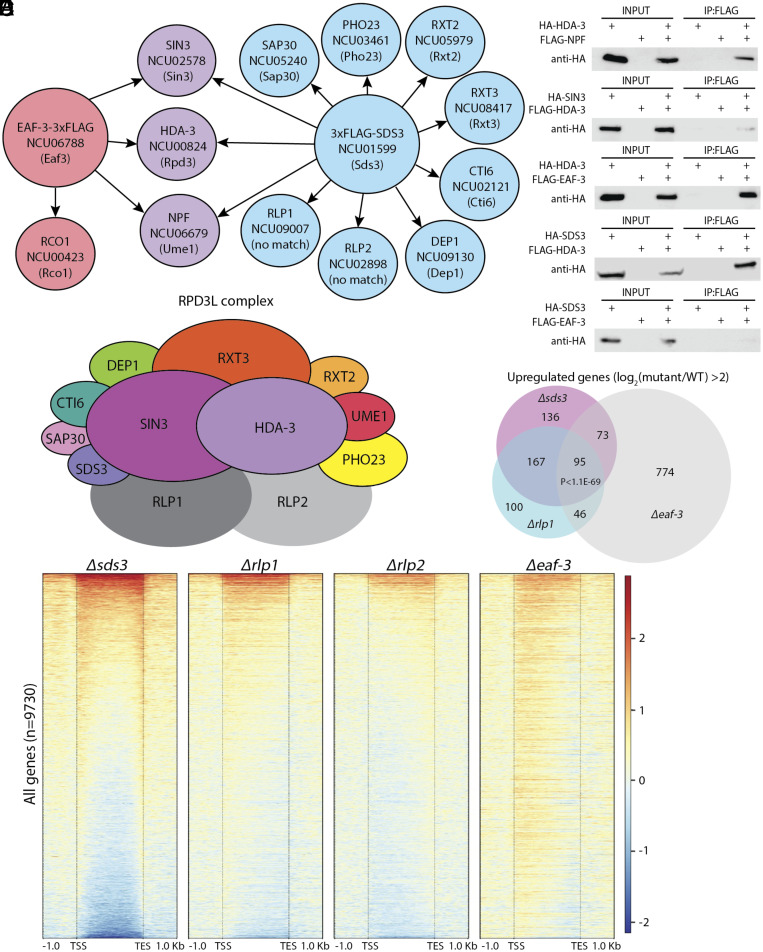
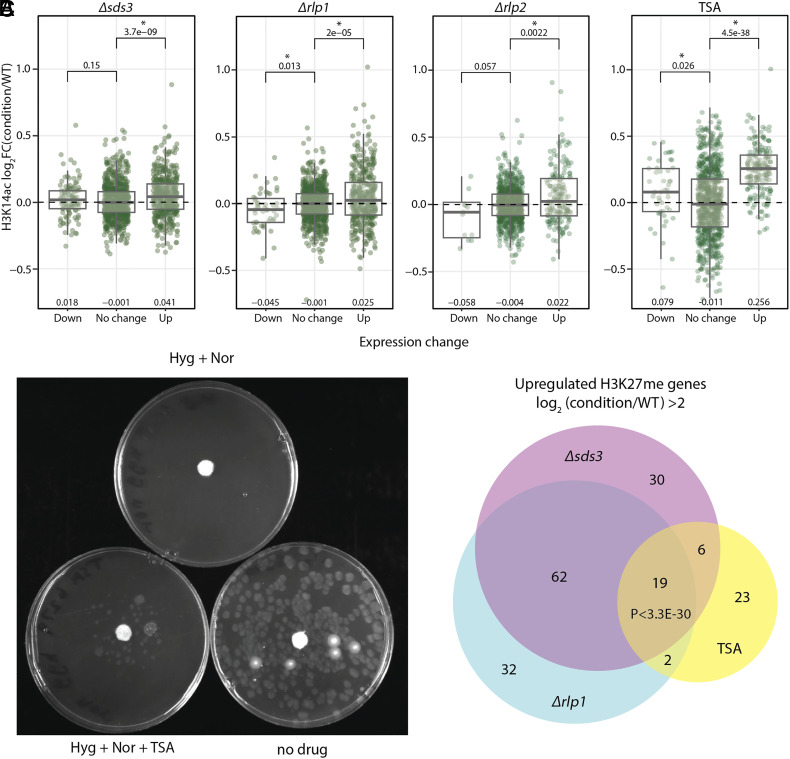
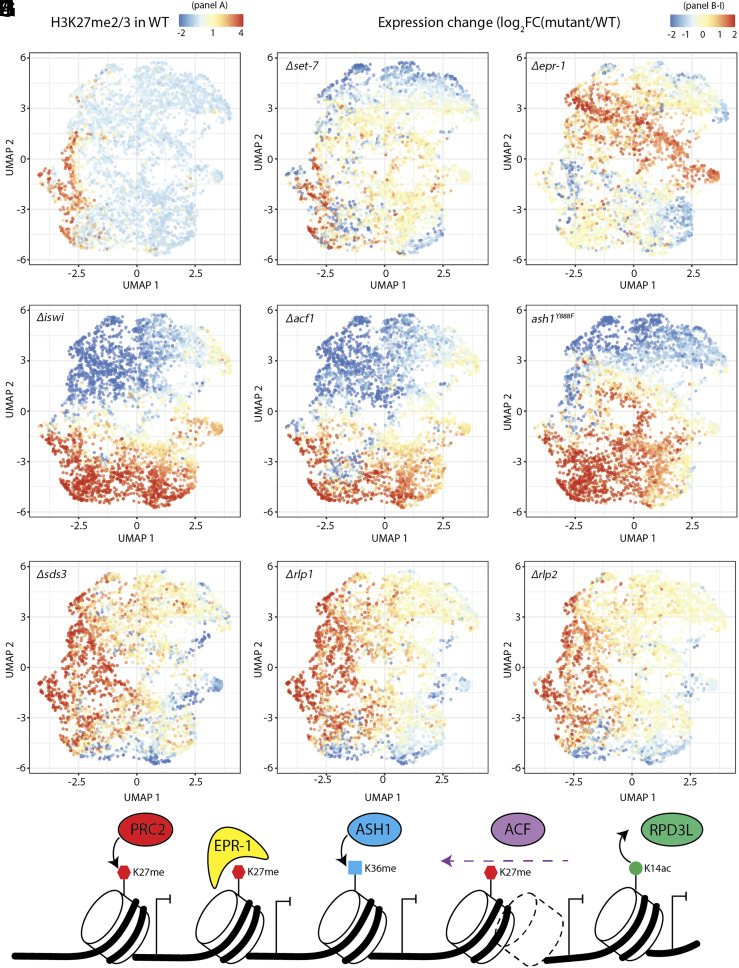
Repression of facultative heterochromatin is essential for developmental processes in numerous organisms. Methylation of histone H3 lysine 27 (H3K27) by Polycomb repressive complex 2 is a prominent feature of facultative heterochromatin in both fungi and higher eukaryotes. Although this methylation is frequently associated with silencing, the detailed mechanism of repression remains incompletely understood. We utilized a forward genetics approach to identify genes required to maintain silencing at facultative heterochromatin genes in Neurospora crassa and identified three previously uncharacterized genes that are important for silencing: sds3 (NCU01599), rlp1 (RPD3L protein 1; NCU09007), and rlp2 (RPD3L protein 2; NCU02898). We found that SDS3, RLP1, and RLP2 associate with N. crassa homologs of the Saccharomyces cerevisiae Rpd3L complex and are required for repression of a subset of H3K27-methylated genes. Deletion of these genes does not lead to loss of H3K27 methylation but increases acetylation of histone H3 lysine 14 at up-regulated genes, suggesting that RPD3L-driven deacetylation is a factor required for silencing of facultative heterochromatin in N. crassa, and perhaps in other organisms.

Keywords: H3K27 methylation; epigenetics; histone modification; polycomb repressive complex; transcriptional silencing.


Conflict of interest statement

Competing interests statement:The authors declare no competing interest.

Figures

Fig. 1.
Fig. 1.
Identification of new mutants that derepress H3K27-methylated genes. (A) Selection scheme based on dual antibiotic resistance markers (hph and nat-1) inserted in a pair of genes (NCU05173 and NCU07152) that are silent in wild type but derepressed upon loss of H3K27 methylation (–6). (B) Representative example of using whole-genome sequencing to identify one mutant, which turned out to be rlp2E28fs. Sequencing of pooled genomic DNA of progeny strains with mutant phenotype identified a region on the right arm of Linkage Group I (LG I) that was enriched for Oak Ridge SNPs and contained a single nucleotide deletion that caused a frameshift at amino acid 28 in rlp2 (NCU02898); marked by asterisk. Each point represents a running average (window size, 10 SNPs; step size, 1 SNP). (C) Location of point mutation in sds3 (NCU01599) leading to early stop codon (stop symbol) at beginning of conserved SDS3 domain (pink rectangle). (D) Location of early frameshift mutation in rlp1 (NCU09007); rlp1 contains many low-complexity regions (purple blocks) but no specific predicted domains and the identified mutation caused an early frameshift in the ORF, marked by asterisk. (E) Locations of four unique mutations in rlp2 (NCU02898) identified in separate strains following UV mutagenesis. rlp2 contains one predicted coiled-coil region (green block) and many low-complexity regions (purple blocks). One mutant carried a large deletion spanning the entire ORF and three mutations led to early frameshifts in the ORF, marked by asterisks. (F) Linear growth rate as measured in “race tubes” for the indicated genotypes, averaged from three technical replicates. Error bars represent 95% CI for the mean growth rate of each genotype, determined by Student’s t test. (GI) Serial dilution silencing spot test for the indicated strains on media with or without nourseothricin. All strains contain PNCU07152::nat-1. Approximate number of conidia in spots is indicated below. (J) Serial dilution spot test silencing assays for the indicated strains on media containing no drug, hygromycin B, or nourseothricin. All strains carry PNCU05173::hph and PNCU07152::nat-1 and wild-type copies of each indicated gene were inserted at the his-3 locus to test for genetic complementation.
Fig. 2.
Fig. 2.
Transcriptional effects of sds3, rlp1, and rlp2 mutations. (A) The expression level (FPKM, fragments per kilobase million) of each gene in the Neurospora genome in Δsds3 is plotted against the expression level in wild type. Two biological replicates were used for each genotype. Differentially expressed (DE) genes marked with H3K27 methylation in WT are indicated with pink dots, and DE genes that do not have H3K27 methylation in WT are marked in green; all other genes are represented as gray dots. DE genes were defined using a significance cutoff of P value < 0.05 and log2 fold change (FC) > 2 for up-regulated genes and P value < 0.05 and log2 FC < –2 for down-regulated genes. The total counts of up- and down-regulated genes are listed for each genotype with the number that are also H3K27-methylated in parentheses. Significance for enrichment of H3K27-methylated genes was calculated by Fisher’s exact test for up-regulated genes (P = 1.34E-27) and down-regulated genes (P = 0.709). (B) Similar to (A) but for Δrlp1. Significance of H3K27me gene enrichment was calculated by Fisher’s exact test for up-regulated genes (P = 1.53E-32) and down-regulated genes (P = 0.006). (C) Similar to (A) but for Δrlp2. Significance of H3K27me gene enrichment was calculated by Fisher’s exact test for up-regulated genes (P = 8.19E−22) and down-regulated genes (P = 1.0). (D) Venn diagram showing overlap of up-regulated genes (log2 FC > 2; P value < 0.05) in Δsds3, Δrlp1, and Δrlp2, totaling n = 623 genes. Significant overlap (P < 1.76E−117) determined by hypergeometric probability test. (E) Similar to (D) but only showing up-regulated H3K27-methylated genes (n = 153). Significant overlap (P < 1.03E−59) determined by hypergeometric probability test. (F) Clustered heatmap of transcript log2 FC, sorted to Δsds3, then Δrlp1, Δrlp2, ash1Y888F, Δacf1, Δset-7, and Δepr-1. All H3K27-methylated genes that significantly changed in at least one mutant are included (n = 248). Number of genes in each cluster is indicated to the left of the heatmap.
Fig. 3.
Fig. 3.
Effect of Δsds3, Δrlp1, and Δrlp2 mutations on H3K27 methylation. (A) H3K27me2/3 levels in Δsds3, Δrlp1, and Δrlp2 strains. ChIP-seq tracks show average levels of H3K27me2/3 merged from two biological replicates for the indicated strains on the indicated chromosome (Linkage Group II). Y axis maximum is 3,000 RPKM for all tracks. (B) Enlarged view of ChIP-seq tracks showing the region on LG II indicated in (A). Y axis maximum is 3,000 RPKM for all tracks. (C) Scatter plots graphing the H3K27me levels of Δsds3 against those of WT levels at each gene (n = 9,730). Genes with a significant gain in Δsds3 (P-value < 0.05, log2 FC > 1) are colored green and genes with a log2 FC < −1. Merged values of biological replicates of ChIP-seq are shown. (D) Similar to (C) but for Δrlp1 (n = 9,730). (E) Similar to (C) but for Δrlp2 (n = 9,730). (F) Stacked bar chart depicting percentage of up-regulated H3K27-methylated genes that gained H3K27me2/me3 (P-value < 0.05, log2 FC >1) in red, log2 FC < −1, or had no change in H3K27me2/me3 in gray for Δsds3, Δrlp1, and Δrlp2, based on biological replicates of ChIP-seq data. (G) Box plots of transcript FC [log2 (mutant/WT)] for all genes up-regulated in both Δrlp1 and Δrlp1 Δset-7 (n = 235) grouped by indicated genotypes. Mean FC for each genotype is displayed at the bottom of box plots. Merged mRNA-seq data from biological replicates were used. P-value is listed above box plots and was calculated by a two-sided Mann–Whitney U test.
Fig. 4.
Fig. 4.
SDS3, RLP1, and RLP2 interact with RPD3L complex but not RPD3S complex. (A) Graphical representation of peptide interactions identified by immunoprecipitation followed by mass spectrometry (IP-MS) using 3xFLAG-SDS3 or EAF-3-3xFLAG as “bait” proteins. Arrows point from bait to proteins with significant interactions (identified peptides covering >20% of the protein). RPD3S subunits are represented by pink circles, core RPD3 subunits are shown as purple circles, and RPD3L subunits are colored blue. N. crassa protein names are listed with homologous S. cerevisiae protein names indicated in parentheses, or “no match” in parentheses if no S. cerevisiae homolog was identified. (B) Coimmunoprecipitation western blot showing HA signal in the indicated strains. Results from samples following FLAG immunoprecipitation are shown on the right while results from the corresponding protein lysate samples before immunoprecipitation (input) are shown on the left. (C) Schematic of N. crassa RPD3L complex based on IP-MS results. Proteins are proportionally sized by molecular weight. Subunits homologous to S. cerevisiae RPD3L are colored and outlined in black, and subunits unique to Neurospora are gray and have no outline. (D) Venn diagram showing overlap of up-regulated genes [log2 (mutant/WT) > 2; P < 0.05] in Δsds3, Δrlp1, and Δeaf-3, totaling n = 1,391. Significant overlap (P < 1.07E-69) determined by hypergeometric probability test. (E) Heatmap illustrating change in RNA abundance across gene bodies as determined by mRNA-seq in Δsds3, Δrlp1, Δrlp2, and Δeaf-3 at all genes (n = 9,730). Replicates were normalized, averaged, and ratios of log2 FC were determined and plotted in decreasing order of log2 FC in Δsds3.
Fig. 5.
Fig. 5.
HDAC inhibition and RPD3L mutations derepress H3K27-methylated genes and increase H3K14 acetylation at up-regulated genes. (A) Box plots of H3K14ac FC [log2 (condition/WT)] for each gene in indicated conditions, grouped by expression change from wild type into down-regulated genes, no expression change, and up-regulated genes. For visualization, up to 800 genes were randomly selected from each category to be plotted. Mean FC for each group is displayed at the bottom of box plots. Merged ChIP-seq and mRNA-seq data from biological replicates were used. P-values are listed above box plots and were calculated by the Mann–Whitney U test; asterisks indicate significant P-values. For TSA condition, N6279 was grown with 5 µL TSA (5 μg/μL) added to 5 mL Vogel’s media and compared to N6279 grown with no TSA added and merged data from technical replicates were used. (B) Plate tests with conidia of strain N6279 grown in presence of antibiotics with and without Trichostatin A. 1,000 conidia were plated, 5 µL of TSA (5 μg/μL) or sterile water was added to a sterile paper disk in the center of the plate, and 10 mL top agar (0.7%) containing hygromycin and nourseothricin, or no antibiotics, was then added on top. Plates were imaged after 72 h of incubation at 32 °C. (C) Venn diagram showing overlap of up-regulated H3K27-methylated genes (log2 FC > 2; P value < 0.05) in Δsds3, in Δrlp1, and in N6279 treated with Trichostatin A (5 μg) based on merged replicates of mRNA-seq data, totaling n = 174. Significant overlap (P < 3.30E-30) determined by hypergeometric probability test.
Fig. 6.
Fig. 6.
RPD3L-mediated deacetylation is a previously unrecognized repressive mechanism acting at facultative heterochromatin. (A) UMAP modeling depicting H3K27me2/3 score at all genes up-regulated in at least two conditions used for modeling (n = 4,317). Genes are colored by H3K27me2/3 levels in wild type. Merged ChIP-seq biological replicates were used for analysis. (BI) UMAP modeling depicting mRNA-seq score [log2 (mutant/WT)] at all genes up-regulated in at least two conditions used for modeling for each indicated mutant genotype (n = 4,317). Genes are colored by expression change from wild type with dark red dots marking genes that increased expression in mutant and dark blue dots marking genes that decreased expression in mutant relative to wild type. Merged mRNA-seq biological replicates were used for analysis. (J) Model of mechanisms currently known to be involved in repression of facultative heterochromatin in Neurospora: H3K27 methylation deposited by the PRC2 complex, silencing mediated by EPR-1, H3K36 methylation deposited by ASH1, a 50 bp upstream shift of the +1 nucleosome by the ACF complex, or H3K14 deacetylation by the RPD3L complex. Although each mechanism is depicted acting on a different genomic region, they often overlap in the genes regulated. Loss of any one mechanism is sufficient to derepress a subset of, but not all, H3K27-methylated genes, implying that facultative heterochromatin silencing is mediated by this network of overlapping factors rather than a linear pathway.

Similar articles

Cited by

References

    1. Margueron R., Reinberg D., The Polycomb complex PRC2 and its mark in life. Nature 469, 343–349 (2011). - PMC - PubMed
    1. Wiles E. T., Selker E. U., H3K27 methylation: A promiscuous repressive chromatin mark. Curr. Opin. Genet. Dev. 43, 31–37 (2017). - PMC - PubMed
    1. Jamieson K., Rountree M. R., Lewis Z. A., Stajich J. E., Selker E. U., Regional control of histone H3 lysine 27 methylation in Neurospora. Proc. Natl. Acad. Sci. U.S.A. 110, 6027–6032 (2013). - PMC - PubMed
    1. McNaught K. J., Wiles E. T., Selker E. U., Identification of a PRC2 accessory subunit required for subtelomeric H3K27 methylation in Neurospora crassa. Mol. Cell Biol. 40, e00003-20 (2020). - PMC - PubMed
    1. Wiles E. T., Mumford C. C., McNaught K. J., Tanizawa H., Selker E. U., The ACF chromatin-remodeling complex is essential for Polycomb repression. eLife 11, e77595 (2022). - PMC - PubMed