. 2024 Jul 29;15(7):538.
doi: 10.1038/s41419-024-06938-6.

CHIP-mediated ubiquitin degradation of BCAT1 regulates glioma cell proliferation and temozolomide sensitivity

Affiliations

CHIP-mediated ubiquitin degradation of BCAT1 regulates glioma cell proliferation and temozolomide sensitivity

Zhuo Lu et al. Cell Death Dis. .

Abstract

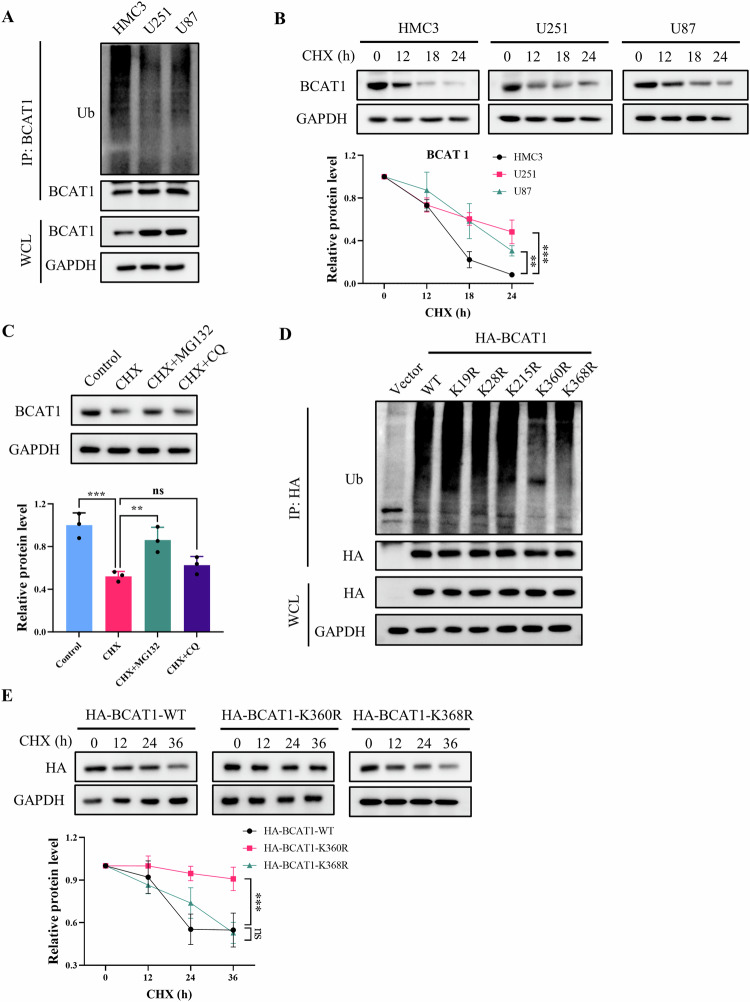
Glioma, a malignant and infiltrative neoplasm of the central nervous system, poses a significant threat due to its high mortality rates. Branched-chain amino acid transaminase 1 (BCAT1), a key enzyme in branched-chain amino acid (BCAA) catabolism, exhibits elevated expression in gliomas and correlates strongly with poor prognosis. Nonetheless, the regulatory mechanisms underlying this increased BCAT1 expression remains incompletely understood. In this study, we reveal that ubiquitination at Lys360 facilitates BCAT1 degradation, with low ubiquitination levels contributing to high BCAT1 expression in glioma cells. The Carboxyl terminus of Hsc70-interacting protein (CHIP), an E3 ubiquitin ligase, interacts with BCAT1 via its coiled-coil (CC) domain, promoting its K48-linkage ubiquitin degradation through proteasomal pathway. Moreover, CHIP-mediated BCAT1 degradation induces metabolic reprogramming, and impedes glioma cell proliferation and tumor growth both in vitro and in vivo. Furthermore, a positive correlation is observed between low CHIP expression, elevated BCAT1 levels, and unfavorable prognosis among glioma patients. Additionally, we show that the CHIP/BCAT1 axis enhances glioma sensitivity to temozolomide by reducing glutathione (GSH) synthesis and increasing oxidative stress. These findings underscore the critical role of CHIP/BCAT1 axis in glioma cell proliferation and temozolomide sensitivity, highlighting its potential as a diagnostic marker and therapeutic target in glioma treatment.


Conflict of interest statement

The authors declare no competing interests.

Figures

Fig. 1
Fig. 1. Ubiquitylation at Lys360 promotes BCAT1 degradation through proteasomal pathway.
A BCAT1 ubiquitination levels in HMC3, U251 and U87 cells were detected by immunoprecipitation and western blot. B HMC3, U251 and U87 cells were treated with 50 µg/mL cycloheximide, and BCAT1 expression was detected by western blot. C U251 cells were treated with 50 µg/mL cycloheximide with or without 10 µM MG132 or 10 µM chloroquine for 18 h, and BCAT1 expression was detected by western blot. D U251 cells were transfected with HA-tagged wild-type BCAT1 or BCAT1 mutant plasmid, and BCAT1 ubiquitination was detected by immunoprecipitation and western blot. E U251 cells were transfected with HA-tagged wild-type BCAT1 plasmid or BCAT1 mutant plasmid, and treated with 50 µg/mL cycloheximide. HA-BCAT1 expression was detected by western blot. Data were presented as mean ± SD of three independent experiments. ns p > 0.05, **p < 0.01, ***p < 0.001. CHX cycloheximide, CQ chloroquine.
Fig. 2
Fig. 2. CHIP binds to BCAT1 through coiled-coil domain.
A Predicted ubiquitin ligase for BCAT1 on http://ubibrowser.bio-it.cn/ubibrowser/. B, C U251 cells were transfected with HA-BCAT1 with or without Flag-CHIP plasmid. The interaction between BCAT1 and CHIP was detected by immunoprecipitation and western blot. D Schematic diagram of wile-type CHIP and its truncated mutants. E U251 cells were transfected with HA-BCAT1 plasmid with or without Flag-tagged wild-type CHIP or CHIP mutant plasmid, and immunoprecipitation and western blot was performed. F U251 cells were transfected with Flag-tagged CHIP plasmid and HA-tagged wild-type BCAT1 or BCAT1 mutant plasmid, and immunoprecipitation and western blot was performed. G Subcellular location of BCAT1 and CHIP was detected by immunofluorescence. Scale bar = 50 μm. H In vitro binding assay of GST-BCAT1 and CHIP proteins.
Fig. 3
Fig. 3. CHIP induces K48-linkage BCAT1 ubiquitylation at Lys360.
A U251 cells were co-transfected with HA-BCAT1 and His-ubiquitin plasmid with or without CHIP siRNA. BCAT1 ubiquitination was detected by immunoprecipitation and western blot. B U251 cells were co-transfected with HA-BCAT1 and His-ubiquitin plasmid with or without Flag-CHIP plasmid. Cells were then treated with 10 µM MG132 for 12 h, and BCAT1 ubiquitination was detected by immunoprecipitation and western blot. C U251 cells were co-transfected with HA-BCAT1 and His-ubiquitin plasmid with or without Flag-CHIP plasmid, and BCAT1 ubiquitination was detected by immunoprecipitation and western blot. D, E U251 cells were co-transfected with HA-BCAT1 and His-ubiquitin plasmid with or without Flag-CHIP plasmid. BCAT1 ubiquitin chain linkage was detected by immunoprecipitation and western blot. F U251 cells were co-transfected with HA-tagged wild-type BCAT1 plasmid or BCAT1 mutant plasmid and His-ubiquitin, Flag-CHIP plasmid. BCAT1 ubiquitination was detected by immunoprecipitation and western blot. G U251 cells were transfected with HA-BCAT1, His-ubiquitin plasmid and Flag-tagged wild-type CHIP plasmid or CHIP mutant plasmid. BCAT1 ubiquitination was detected by immunoprecipitation and western blot.
Fig. 4
Fig. 4. CHIP promotes BCAT1 degradation.
A U251 cells were transfected with scramble siRNA or CHIP siRNA. BCAT1 and CHIP expression were detected by western blot. B U251 cells were transfected with Flag-tagged wild-type CHIP plasmid or CHIP mutant plasmid. BCAT1 and CHIP expression were detected by western blot. C U251 cells were transfected with scramble siRNA or CHIP siRNA, and treated with 50 µg/mL cycloheximide. BCAT1 expression were detected by western blot. D U251 cells were transfected with Flag-tagged wild-type CHIP plasmid or CHIP mutant plasmid, and treated with 50 µg/mL cycloheximide. BCAT1 expression were detected by western blot. E U251 cells were transfected with HA-BCAT-K360R plasmid with or without Flag-CHIP plasmid, and treated with 50 µg/mL cycloheximide. BCAT1 expression were detected by western blot. Data were presented as mean ± SD of three independent experiments. ns p > 0.05, *p < 0.05, **p < 0.01, ***p < 0.001.
Fig. 5
Fig. 5. CHIP inhibits glioblastoma cell proliferation.
AC U251 cells were transfected with vector or Flag-CHIP plasmid. Cell proliferation and colony formation were detected by crystal violet staining and EdU staining. DF U251 cells were transfected with scramble siRNA or CHIP siRNA. Cell proliferation and colony formation were detected by crystal violet staining and EdU staining. Scale bar = 200 μm. Data were presented as mean ± SD of three independent experiments. ***p < 0.001.
Fig. 6
Fig. 6. CHIP-mediated BCAT1 degradation inhibits tumor growth in xenograft model.
A U87 cells stably expressing CHIP and BCAT1K360R were constructed. BD Cell proliferation was detected by crystal violet staining and EdU staining. EG Male NOD/SCID mice were subcutaneously injected with wild-type U87 cells, U87-CHIP cells or U87-CHIP/BCAT1K360R cells. Fourteen days later, mice were sacrificed and tumors were dissected and photographed (E). Volume (F) and weight (G) of xenograft tumors were measured. n = 5. H H&E staining and immunohistochemistry analysis of the sections of tumor. Scale bar = 50 μm. Data were presented as mean ± SD. ** p < 0.01, ***p < 0.001.
Fig. 7
Fig. 7. CHIP-mediated BCAT1 degradation induces metabolic reprogramming.
Extracts from wild-type U87 cells, U87-CHIP and U87-CHIP/BCAT1K360R cells were analyzed using an LC-ESI-MS/MS system. A Heatmap showing a visualization of clustering analyses of metabolites identified from cell lines. BJ Relative levels of leucine, isoleucine, valine, citrate, fumarate, malate, succinate, lactate and ATP in different cell lines. K KEGG pathway analysis of the metabolomic data. Data were presented as mean ± SD, n = 5. * p < 0.05, ** p < 0.01, ***p < 0.001.
Fig. 8
Fig. 8. Low CHIP expression correlates with high BCAT1 expression and poor prognosis of glioblastoma patients.
A Immunohistochemistry staining of human glioma tissue microarray with anti-BCAT1 antibody. B Representative images of immunohistochemistry staining of BCAT1. C Immunohistochemistry staining of human glioma tissue microarray with anti-CHIP antibody. D Representative images of immunohistochemistry staining of CHIP. E, F Concomitantly high BCAT1 expression (E) and low CHIP expression (F) positively correlates with advanced glioma grades. G, H Kaplan-Meier survival curve of 149 patients in the glioma tissue microarray based on BCAT1 and CHIP expression. I Correlation between BCAT1 and CHIP expression in glioma tissue microarrays. Scale bar = 100 μm.
Fig. 9
Fig. 9. CHIP-mediated BCAT1 degradation enhances temozolomide sensitivity in glioma cells.
A IC50 values of temozolomide for the wild-type U87, U87-CHIP and U87-CHIP/BCAT1K360R cells. B wild-type U87, U87-CHIP and U87-CHIP/BCAT1K360R cells were treated with 100 μM temozolomide for 48 h. The ratio of apoptotic cells was detected by Annexin/PI staining and flow cytometry. C Quantification of the ratio of apoptotic cells. D Relative contents of GSH in wild-type U87, U87-CHIP and U87-CHIP/BCAT1K360R cells. EG Wild-type U87, U87-CHIP and U87-CHIP/BCAT1K360R cells were treated with 100 μM temozolomide for 48 h. Intracellular ROS level was detected by DHE staining. Representative immunofluorescence images were shown (E), and fluorescence density was quantified by flow cytometry (F). Scale bar = 100 μm. The expression of Cleaved Capase-3 and Cleaved Caspase-9 was detected by western blot (G). Data were presented as mean ± SD of three independent experiments. ***p < 0.001. TMZ temozolomide.
Fig. 10
Fig. 10. CHIP-mediated BCAT1 degradation enhances temozolomide sensitivity in xenograft model.
A Schematic diagram of xenograft model and temozolomide administration. (B-D) NOD SCID mice were subcutaneously injected with wild-type U87 cells and intraperitoneally injected with temozolomide. n = 4. Image of excised tumors was shown (B). Tumor volume (C) and weight (D) was measured. EG NOD SCID mice were subcutaneously injected with U87-CHIP or U87-CHIP/BCAT1K360R cells and intraperitoneally injected with temozolomide. n = 5. Image of excised tumors was shown (E). Tumor volume (F) and weight (G) was measured. H H&E staining and immunohistochemistry staining of cleaved Caspase-3 and cleaved Caspase-9 in tumor sections were shown. Scale bar = 50 μm. Data were presented as mean ± SD. ns p > 0.05, **p < 0.05, **p < 0.01, ***p < 0.001.

References

    1. Chen R, Smith-Cohn M, Cohen AL, Colman H. Glioma subclassifications and their clinical significance. Neurotherapeutics 2017;14:284–97. 10.1007/s13311-017-0519-x - DOI - PMC - PubMed
    1. Alexander BM, Cloughesy TF. Adult Glioblastoma. J Clin Oncol. 2017;35:2402–9. 10.1200/JCO.2017.73.0119 - DOI - PubMed
    1. Ostrom QT, Gittleman H, Stetson L, Virk SM, Barnholtz-Sloan JS. Epidemiology of gliomas. Cancer Treat Res. 2015;163:1–14. 10.1007/978-3-319-12048-5_1 - DOI - PubMed
    1. Xu S, Tang L, Li X, Fan F, Liu Z. Immunotherapy for glioma: Current management and future application. Cancer Lett. 2020;476:1–12. 10.1016/j.canlet.2020.02.002 - DOI - PubMed
    1. Zhang XN, Yang KD, Chen C, He ZC, Wang QH, Feng H, et al. Pericytes augment glioblastoma cell resistance to temozolomide through CCL5-CCR5 paracrine signaling. Cell Res. 2021;31:1072–87. 10.1038/s41422-021-00528-3 - DOI - PMC - PubMed

MeSH terms

LinkOut - more resources