. 2024 Jul 29;15(1):6210.
doi: 10.1038/s41467-024-49891-w.

Widespread exposure to SARS-CoV-2 in wildlife communities

Affiliations

Widespread exposure to SARS-CoV-2 in wildlife communities

Amanda R Goldberg et al. Nat Commun. .

Erratum in

  • Author Correction: Widespread exposure to SARS-CoV-2 in wildlife communities.
    Goldberg AR, Langwig KE, Brown KL, Marano JM, Rai P, King KM, Sharp AK, Ceci A, Kailing CD, Kailing MJ, Briggs R, Urbano MG, Roby C, Brown AM, Weger-Lucarelli J, Finkielstein CV, Hoyt JR. Goldberg AR, et al. Nat Commun. 2024 Aug 13;15(1):6940. doi: 10.1038/s41467-024-51220-0. Nat Commun. 2024. PMID: 39138180 Free PMC article. No abstract available.

Abstract

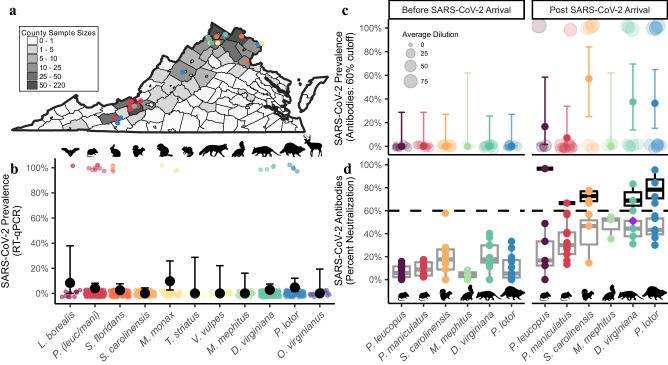
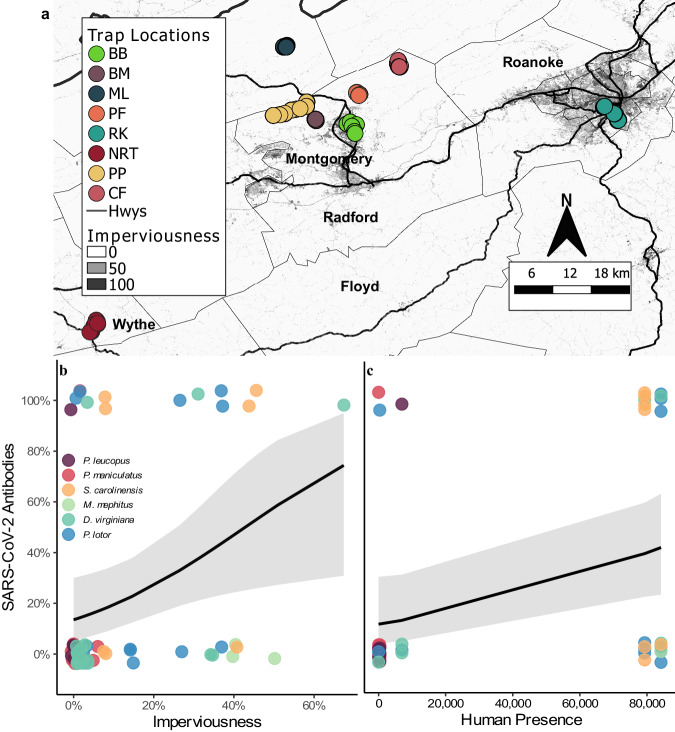
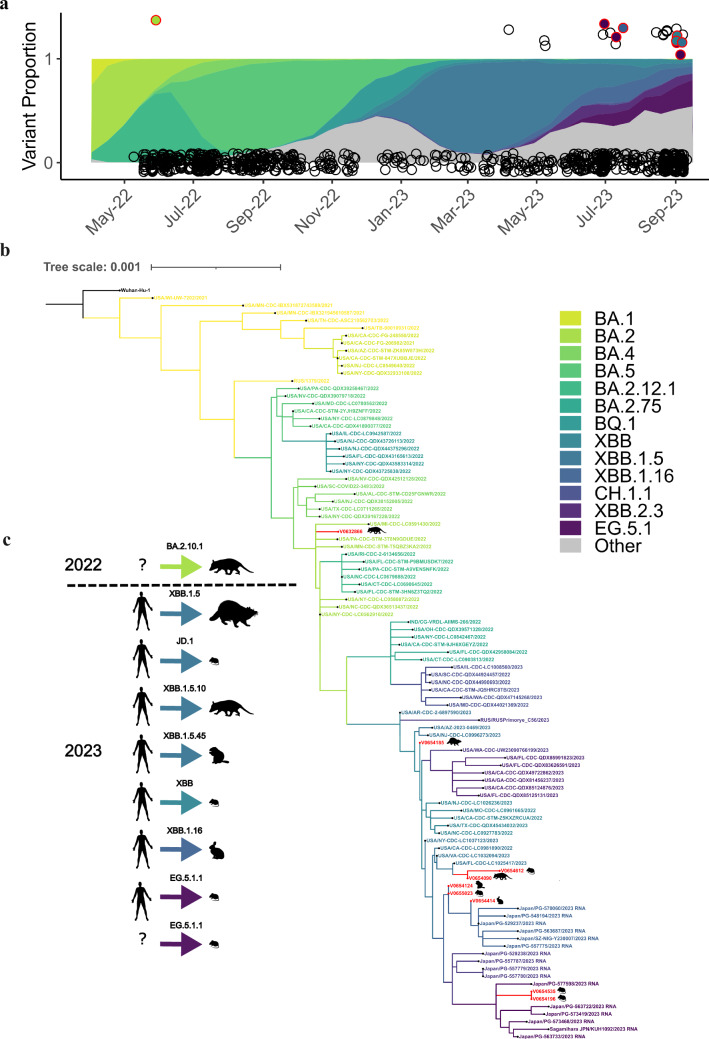
Pervasive SARS-CoV-2 infections in humans have led to multiple transmission events to animals. While SARS-CoV-2 has a potential broad wildlife host range, most documented infections have been in captive animals and a single wildlife species, the white-tailed deer. The full extent of SARS-CoV-2 exposure among wildlife communities and the factors that influence wildlife transmission risk remain unknown. We sampled 23 species of wildlife for SARS-CoV-2 and examined the effects of urbanization and human use on seropositivity. Here, we document positive detections of SARS-CoV-2 RNA in six species, including the deer mouse, Virginia opossum, raccoon, groundhog, Eastern cottontail, and Eastern red bat between May 2022-September 2023 across Virginia and Washington, D.C., USA. In addition, we found that sites with high human activity had three times higher seroprevalence than low human-use areas. We obtained SARS-CoV-2 genomic sequences from nine individuals of six species which were assigned to seven Pango lineages of the Omicron variant. The close match to variants circulating in humans at the time suggests at least seven recent human-to-animal transmission events. Our data support that exposure to SARS-CoV-2 has been widespread in wildlife communities and suggests that areas with high human activity may serve as points of contact for cross-species transmission.


Conflict of interest statement

The authors declare no competing interests.

Figures

Fig. 1
Fig. 1. SARS-CoV-2 RNA and neutralizing antibody prevalence in wildlife communities.
a Represents counties where swabs were collected (both wildlife rehabilitation centers and study sites). Gray scale indicates sample sizes. Circles represent SARS-CoV-2 positive samples and color indicates species in (b). Prevalence of (b) RT-qPCR (quantitative reverse transcription polymerase chain reaction) detections collected between May 2022 and September 2023 (n = 757). Detections include species with >10 individuals sampled, and black points indicate prevalence (percentage of individuals with positive detections) and 95% confidence intervals (See Supplementary Table 1 for full dataset that includes all 23 species, n = 789). c Shows seroprevalence measured using plaque reduction neutralization tests (PRNT) for species sampled both prior to SARS-CoV-2 arrival in 2020 (n = 49) and samples collected in our study between June and July 2022 (n = 67, Supplementary Data 2). The size of each point in (c) is in relation to the percent neutralization. Samples with a 60% or greater percent neutralization were considered positive samples. Solid color points represent seroprevalence estimates (percentage of individuals positive for neutralizing antibodies) and error bars represent 95% confidence intervals. d Represents percent neutralization values of serum samples to SARS-CoV-2 sampled both prior (n = 49) and post (n = 67) SARS-CoV-2 arrival. The black dotted horizontal line represents a 60% neutralization cut-off. The purple diamond represents neutralizing antibody titers for a Virginia opossum who was found conclusively RT-qPCR positive one month prior. Box plots show the median (center line) and interquartile range (25th–75th percentile of the data) and whiskers indicate range of data 1.5 times the interquartile below and above the 25th and 75th percentile, respectively. Gray boxes represent samples with less than a 60% neutralization value, and black boxes represent samples with greater than a 60% neutralization value. All data points represent samples taken from individual animals which serve as biological replicates. For each PRNT we performed three technical replicates, which were averaged for each individual. Organism silhouettes were sourced from PhyloPic.
Fig. 2
Fig. 2. Examination of SARS-CoV-2 exposure at the human-wildlife interface.
a Shows imperviousness with darker shades representing more urban areas. Circles represent trap locations (n = 856), and sites (n = 8) are indicated by different color circles (see Supplementary Methods for trap locations). Sites PF and NRT were sampled in both 2022 and 2023, sites BB, BM, ML, and RK were only sampled in 2022, and sites PP and CF were only sampled in 2023. Serology samples were collected at all study sites in 2022 except PF. b Shows the positive relationship (intercept: −1.665 ± 0.48 SE, urbanization slope 0.039 ± 0.02 SE, p = 0.031) between urbanization (imperviousness) and seroprevalence collected from animals (n = 67) at five different sites in VA, USA. Panel (c) shows the effects of average monthly human presence (population density collected from the 2020 U.S. Census within the trapping area of each site (Blacksburg) or use estimates from trail counters or landowners) on seroprevalence (intercept: -1.132 ± 0.36 SE, human presence coeff: 0.705 ± 0.35 SE, p = 0.044, n = 49). Black lines indicate model estimates from generalized linear mixed models and the gray ribbons (shaded areas around the line) represent 95% confidence intervals. Color circles in (b) and (c) indicate species sampled.
Fig. 3
Fig. 3. SARS-CoV-2 collected from wildlife in comparison to human samples.
a Color ribbons show the proportion of each lineage circulating in humans in sampling region at the time of data collection. Circles represent each individual animal sampled (n = 789). A positive sample has a value of 1 and a negative sample has a value of 0. Circles outlined in red represent a positive sample with lineage assignment (n = 9, Supplementary Figs. 2–9; Table 3). The fill color within each red circle represents the lineage it was assigned. b A phylogenetic tree was generated using maximum likelihood analysis and GTR + G4 substitution models to visualize the relatedness of the nine whole genome sequences obtained from wild animals (n = 9) to SARS-CoV-2 sequences derived from human hosts (n = 90) representing different PANGO lineages. Additional phylogenetic analyses show the placement of the SARS-CoV-2 sequences from each individual wild animal within individual lineages in more detail (Supplementary Figs. 2–9). c Suspected transmission origin for each individual is represented by a human silhouette or a question mark (“?”) if the origin is suspected to be either a human-to-animal or animal-to-animal transmission. Inferences about transmission were determined by phylogenetic analysis using related human host sequences and our sequences collected from wild animals as shown in Supplementary Figs. 2–9 and in Supplementary Table 2. We also considered any unique mutations not described from a human host, as those mutations may have come from the originating hosts’ virus. The arrow color indicates the lineage assignment and silhouettes indicate the species from which the sample was collected. Across all panels color indicates the same lineage of SARS-CoV-2.
Fig. 4
Fig. 4. Molecular modeling of the unique S mutation of SARS-CoV-2 collected from a Virginia opossum.
a Representation of the structure of the BA.2 S protein (gray, PDB: 7XO8) in its open conformation bound to the human ACE2 (teal). Residues 471 (red) and 798 (orange) are shown as spheres. Glycans are displayed as sticks colored purple. Top inset: Overlay of E471V (red) and BA.2 (gray). Bottom inset: Overlay of G798D (orange) and BA.2 (gray). b Surface map of the BA.2 S protein (left) and the region surrounding E471V and D798G (right) residues. Residue side chain properties are colored: green for hydrophobic, blue for positively charged, red for negatively charged, teal for polar uncharged, and gray for neutral.

References

    1. World Health Organization. WHO COVID-19 Dashboard.https://covid19.who.int/ (2020).
    1. Drozdz, M. et al. Current state of Kknowledge about role of pets in zoonotic transmission of SARS-CoV-2. Viruses-Basel13, 1149 (2021). 10.3390/v13061149 - DOI - PMC - PubMed
    1. Fritz, M. et al. High prevalence of SARS-CoV-2 antibodies in pets from COVID-19+ households. One Health11, 100192 (2020). 10.1016/j.onehlt.2020.100192 - DOI - PMC - PubMed
    1. Murphy, H. L. & Ly, H. Understanding the prevalence of SARS-CoV-2 (COVID-19) exposure in companion, captive, wild, and farmed animals. Virulence12, 2777–2786 (2021). 10.1080/21505594.2021.1996519 - DOI - PMC - PubMed
    1. Hale, V. L. et al. SARS-CoV-2 infection in free-ranging white-tailed deer. Nature602, 481–486 (2022). 10.1038/s41586-021-04353-x - DOI - PMC - PubMed

Supplementary concepts