. 2024 Jul 29;14(1):17461.
doi: 10.1038/s41598-024-66025-w.

Forskolin reverses the O-GlcNAcylation dependent decrease in GABAAR current amplitude at hippocampal synapses possibly at a neurosteroid site on GABAARs

Affiliations

Forskolin reverses the O-GlcNAcylation dependent decrease in GABAAR current amplitude at hippocampal synapses possibly at a neurosteroid site on GABAARs

Shekinah Phillips et al. Sci Rep. .

Abstract

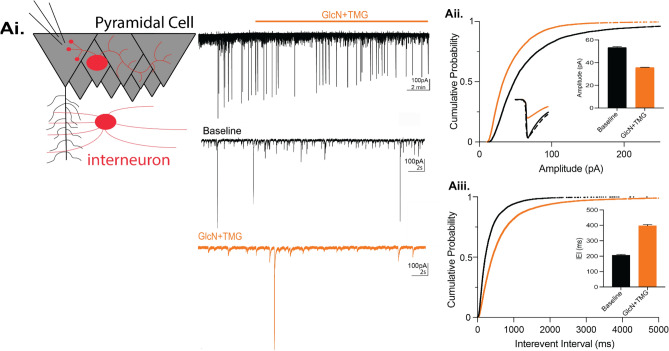
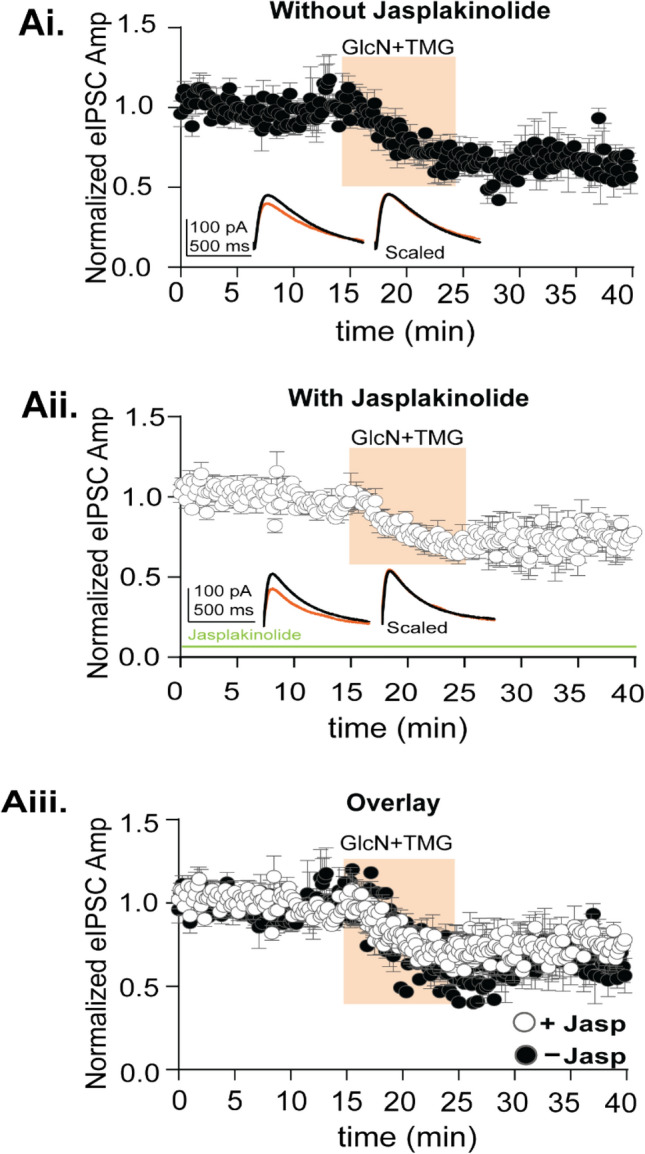
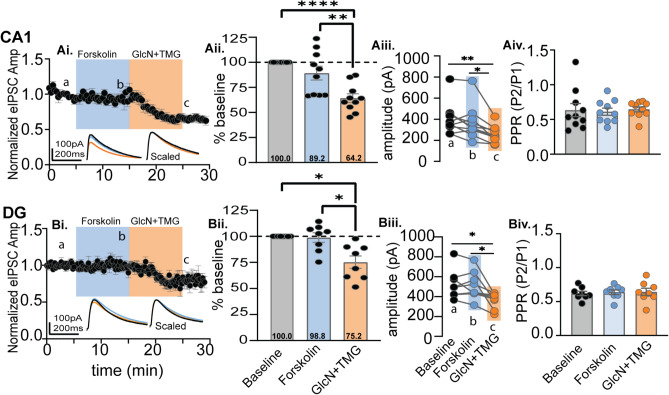
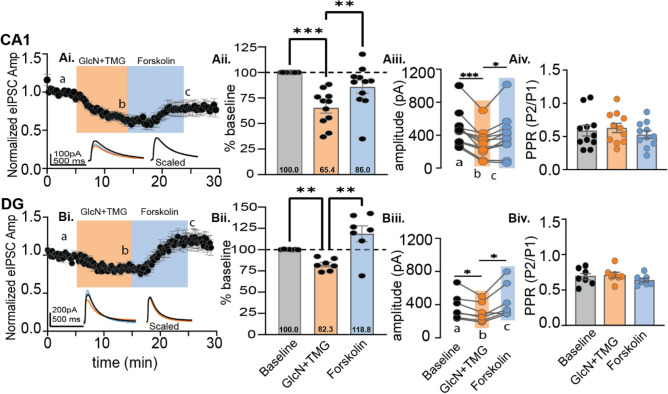
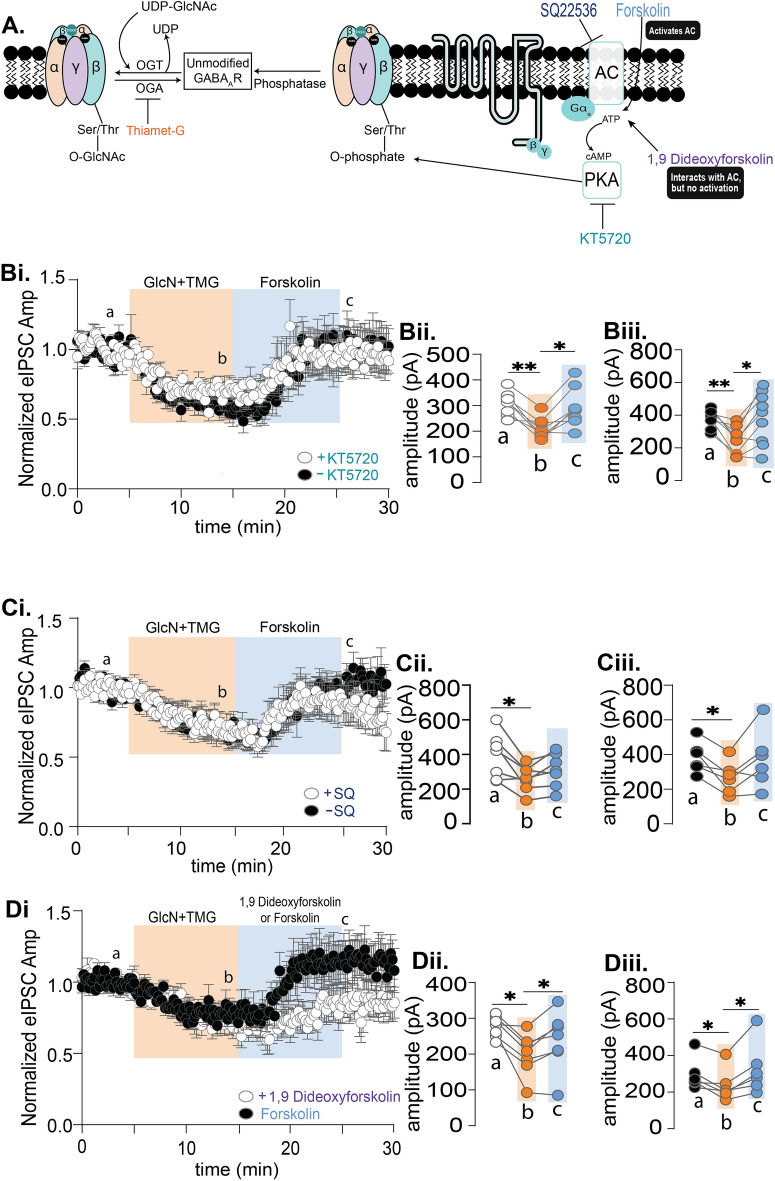
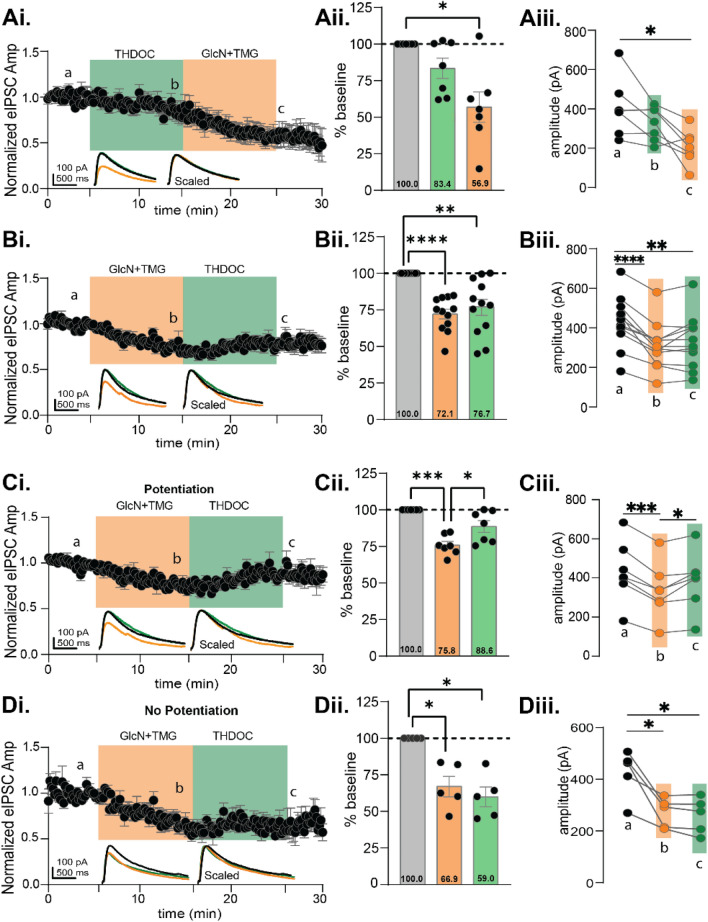
GABAergic transmission is influenced by post-translational modifications, like phosphorylation, impacting channel conductance, allosteric modulator sensitivity, and membrane trafficking. O-GlcNAcylation is a post-translational modification involving the O-linked attachment of β-N-acetylglucosamine on serine/threonine residues. Previously we reported an acute increase in O-GlcNAcylation elicits a long-term depression of evoked GABAAR inhibitory postsynaptic currents (eIPSCs) onto hippocampal principal cells. Importantly, O-GlcNAcylation and phosphorylation can co-occur or compete for the same residue; whether they interact in modulating GABAergic IPSCs is unknown. We tested this by recording IPSCs from hippocampal principal cells and pharmacologically increased O-GlcNAcylation, before or after increasing serine phosphorylation using the adenylate cyclase activator, forskolin. Although forskolin had no significant effect on baseline eIPSC amplitude, we found that a prior increase in O-GlcNAcylation unmasks a forskolin-dependent increase in eIPSC amplitude, reversing the O-GlcNAc-induced eIPSC depression. Inhibition of adenylate cyclase or protein kinase A did not prevent the potentiating effect of forskolin, indicating serine phosphorylation is not the mechanism. Surprisingly, increasing O-GlcNAcylation also unmasked a potentiating effect of the neurosteroids 5α-pregnane-3α,21-diol-20-one (THDOC) and progesterone on eIPSC amplitude in about half of the recorded cells, mimicking forskolin. Our findings show that under conditions of heightened O-GlcNAcylation, the neurosteroid site on synaptic GABAARs is possibly accessible to agonists, permitting strengthening of synaptic inhibition.


Conflict of interest statement

The authors declare no competing interests.

Figures

Figure 1
Figure 1
Acute increase in O-GlcNAcylation reduces spontaneous IPSCs in hippocampal CA1 pyramidal cells. (Ai) (left) Schematic illustrating whole-cell recording of CA1 pyramidal cells (right). Representative sIPSC trace showing baseline and GlcN + TMG application (top) and expanded time scale (bottom) during baseline (black) and GlcN + TMG application (orange). (Aii) Cumulative probability distribution of sIPSC amplitude (p < 0.0001, KS D value = 0.17, Kolmogorov–Smirnov test); inset: (left) average sIPSC trace before (black) and after (orange) GlcN + TMG; scaled trace (dashed) shows no change in rise or decay time of depressed sIPSC. Inset: (right) bar chart showing average (± SEM) sIPSC amplitude. Baseline: 69.7 ± 0.8 pA, GlcN + TMG: 43.5 ± 0.5 pA (p < 0.0001, Wilcoxon matched-pairs signed rank test, n = 9 cells, 6 rats). (Aiii) Cumulative probability distribution of sIPSC interevent interval (p < 0.0001, KS D value = 0.225, Kolmogorov–Smirnov test). Baseline: 344.5 ± 4.7 ms, GlcN + TMG: 767.3 ± 16.6 ms, Inset: (p < 0.0001, Wilcoxon matched-pairs signed rank test, n = 9 cells, 6 rats).
Figure 2
Figure 2
Blocking actin mediated GABAAR endocytosis does not prevent O-GlcNAciLTD in CA1 pyramidal cells. (Ai) Normalized data showing average eIPSC amplitude over time exposed to GlcN + TMG (10 min, orange) after a 15-min baseline without jasp, (p = 0.005, paired t-test, n = 6 cells, 6 rats). Inset: representative eIPSC traces before (black) and after GlcN + TMG (orange) application and scaled average without jasp shows no change in rise or decay time of the eIPSC. (Aii) Normalized data showing average eIPSC amplitude over time exposed to GlcN + TMG (10 min, orange) after a 15-min baseline with jasplakinolide included in the pipette solution (jasp) (p = 0.0005, paired t-test, n = 8 cells, 8 rats). Inset: representative eIPSC traces before (black) and after GlcN + TMG (orange) application and scaled average with jasp shows no change in rise time or decay of the eIPSC. (Aiii) Overlay of the experimental groups showing no significant difference in the average (± SEM) eIPSC amplitude over time (p < 0.0001, One-way ANOVA). Gray horizontal bars represent the mean ± SEM.
Figure 3
Figure 3
O-GlcNAc iLTD is partially dependent upon dynamin-mediated GABAAR endocytosis. (Ai) Normalized data showing average eIPSC amplitude over time exposed to GlcN + TMG (10 min, orange) after a 15-min baseline without dynasore (DMSO-vehicle) (p = 0.005, paired t-test, n = 8 cells, 7 rats). Inset: representative eIPSC traces before (black) and after GlcN + TMG (orange) application and scaled average shows no difference in rise or decay time of the eIPSC. (Aii) Normalized data showing average eIPSC amplitude over time exposed to GlcN + TMG (10 min, orange) after a 5-min baseline in slices incubated in dynasore for 30 min (p = 0.004, paired-test, n = 8 cells, 7 rats). Inset: representative eIPSC traces before (black) and after GlcN + TMG (orange) application and scaled average with dynasore. (Aiii) Overlay of experimental groups showing no significant difference in the average (± SEM) eIPSC amplitude over time (p = 0.08, One-way ANOVA). (Aiii) Separation of two populations in the presence of dynasore where the eIPSC amplitude was significantly increased in one population (white, p = 0.0392, paired t-test, n = 4 cells, 4 rats) and with no effect in the other population (red, p = 0.13, paired t-test, n = 4 cells, 4 rats). Gray horizontal bars represent the mean ± SEM.
Figure 4
Figure 4
Magnitude of the O-GlcNAc iLTD is unaffected by prior application of forskolin. (Ai) CA1: Normalized data showing average eIPSC amplitude over time during baseline (5 min), bath application of forskolin (10 min, blue) and GlcN + TMG (10 min, orange). Inset: overlaid averaged representative eIPSC traces during baseline (black), forskolin (blue), and GlcN + TMG (orange) (left) and scaled (right). (Aii) Bar chart illustrates the average affect of forskolin and GlcN + TMG on eIPSC amplitude from the original baseline (dotted line): 89.2% ± 6.9%, p = 0.39 (forskolin), 64.2% ± 4.4%, p < 0.0001 (GlcN + TMG) and each other (p = 0.0023); (p = 0.0001, RM-ANOVA). (Aiii) For each individual experiment in (Ai), line graphs show the average eIPSC amplitude during the last the 5 min in each condition corresponding to a–c in (Ai) (p = 0.0002, RM-ANOVA, n = 10 cells, 9 rats), Šídák’s: a–c (p = 0.002) and b, c (p = 0.01). Baseline: 404.9 ± 47.9 pA, forskolin: 366.5 ± 50.2 pA, GlcN + TMG: 256.6 ± 25.0 pA (mean ± SEM). (Aiv) Paired-Pulse Ratio (100 ms inter-pulse interval) between baseline, forskolin and GlcN + TMG showed no significant difference (p = 0.69, RM-ANOVA). (Bi) Dentate: Normalized data showing average eIPSC amplitude over time during baseline, bath application of forskolin (blue), and GlcN + TMG (orange). Inset: overlaid averaged representative eIPSC traces during baseline (black) forskolin (blue), GlcN + TMG (orange) (left) and scaled (right). (Bii) Bar chart illustrates the average affect of forskolin and GlcN + TMG from the original baseline (dotted line): 98.8% ± 4.6%, p = 0.98 (forskolin) and 75.2% ± 6.0%, p = 0.0128 (GlcN + TMG) and each other (p = 0.0453); (p = 0.004, RM-ANOVA). (Biii) For each individual experiment in (Bi), line graphs show the average amplitudes for last 5 min in each condition corresponding to a–c in (Bi) (p = 0.005, RM-ANOVA, n = 8 cells, 8 rats), Šídák’s: a–c (p = 0.029) and b, c (p = 0.040). Baseline: 523.7 ± 51.7 pA, forskolin: 514.9 ± 50.5 pA, GlcN + TMG: 360.2 ± 28.3 pA (mean ± SEM). (Biv) Paired-Pulse Ratio between baseline, forskolin and GlcN + TMG showed no significant difference (p = 0.46, RM-ANOVA). Gray horizontal bars represent the mean ± SEM. Šídák’s post hoc depicted with asterisks.
Figure 5
Figure 5
Forskolin reverses O-GlcNAc iLTD in CA1 and dentate. CA1: (Ai) Normalized data showing average eIPSC amplitude over time during baseline (5 min), bath application of GlcN + TMG (10 min, orange), and forskolin (10 min, blue). Inset: overlaid averaged representative eIPSC traces during baseline (black), GlcN + TMG (orange) and forskolin (blue) (left) and scaled (right). (Aii) Bar chart illustrates the average affect of GlcN + TMG and forskolin on eIPSC amplitude from the original baseline (dotted line): 65.4 ± 5.2%, p = 0.0002 (GlcN + TMG) and 86.0% ± 6.3%, p = 0.1561 (forskolin) of baseline and each other (p = 0.0011); (p < 0.0001, RM-ANOVA). (Aiii) For each individual experiment in (Ai), line graphs show the average eIPSC amplitudes during the last 5 min of each condition corresponding to a–c in (Ai) (p < 0.0001, RM-ANOVA, n = 11 cells, 10 rats), Šídák’s: a, b (p = 0.0007) and b, c (p = 0.028), Baseline: 471.2 ± 64.6 pA, GlcN + TMG: 304.6 ± 52.0 pA, Forskolin: 397.6 ± 77.2 pA (mean ± SEM). (Aiv) Paired-Pulse Ratio between baseline, GlcN + TMG and forskolin showed no significant difference (p = 0.06, RM-ANOVA). Dentate: (Bi) Normalized data showing average eIPSC amplitude over time during baseline, bath application of GlcN + TMG (10 min, orange), and forskolin (10 min, blue). Inset: overlaid averaged representative eIPSC traces during baseline (black), GlcN + TMG (orange), and forskolin (blue) (left) and scaled (right). (Bii) Bar chart illustrates the average affect of GlcN + TMG and forskolin on eIPSC amplitude from the original baseline (dotted line): 82.3% ± 2.6%, p = 0.002 (GlcN + TMG) and 118.8% ± 9.3%, p = 0.2500 (forskolin) and each other (p = 0.008); (p = 0.009, RM-ANOVA). (Biii) For each individual experiment in (Bi), line graphs show the averaged eIPSC amplitudes for last 5 min of each condition corresponding to a–c in (Bi) (p = 0.015, RM-ANOVA, n = 7 cells, 6 rats), Šídák’s: a, b (p = 0.0340) and b, c (p = 0.038), Baseline: 376.3 ± 58.7 pA, GlcN + TMG: 306.5 ± 44.2 pA, Forskolin: 443.0 ± 77.1 pA (mean ± SEM). (Biv) Paired-Pulse Ratio between baseline, GlcN + TMG, and forskolin showed no significant difference (p = 0.24, RM-ANOVA). Gray horizontal bars represent the mean ± SEM. Šídák’s post hoc test depicted with asterisks.
Figure 6
Figure 6
Forskolin induced potentiation of the eIPSC amplitude following an increase in O-GlcNAc is resistant to inhibitors of adenylate cyclase and PKA, suggesting serine phosphorylation is not the mechanism. (A) Schematic illustrating possible interaction between serine O-GlcNAcylation and PKA-dependent serine phosphorylation of the GABAA receptor with pharmacological activators and inhibitors. (Bi) Normalized data showing average (± SEM) eIPSC amplitude over time from CA1 pyramidal cells with and without the PKA inhibitor KT5720 (3 μM) during baseline (5 min), GlcN + TMG (10 min, orange), and forskolin application (10 min, blue). KT5720 was applied for 10 min before and during forskolin. (Bii,Biii) For each individual experiment, line graphs show average eIPSC amplitudes for the last 5 min of each condition corresponding to a–c with KT5720 (white) (p = 0.004, RM-ANOVA, n = 8 cells, 6 rats), Šídák’s: a, b (p = 0.002) and b, c (p = 0.011) and without KT5720 (black) (p = 0.007, RM-ANOVA, n = 9 cells, 6 rats), Šídák’s: a, b (p = 0.0011) and b, c (p = 0.0126). (Ci) Normalized data showing average (± SEM) eIPSC amplitude over time with and without the adenylate cyclase inhibitor, SQ22536 (100 μM) during baseline, GlcN + TMG (10 min, orange) and forskolin application (10 min, blue). (Cii,Ciii) For each individual experiment, line graphs show average eIPSC amplitudes for the last 5 min of each condition corresponding to a–c with SQ22536 (white) (p = 0.031, RM-ANOVA, n = 7 cells, 6 rats), Šídák’s: a, b (p = 0.031) and without SQ22536 (black) (p = 0.03, RM-ANOVA, n = 6 cells, 5 rats), Šídák’s: a, b (p = 0.020). (Di) Normalized data showing average (± SEM) eIPSC amplitude over time during baseline, GlcN + TMG (10 min, orange) and application of forskolin or adenylate cyclase inactive analog 1,9 Dideoxyforskolin (10 min, blue). (Dii) The average amplitudes for last 5 min of each condition corresponding to a–c with 1,9 Dideoxyforskolin (p = 0.028 RM-ANOVA, n = 7 cells, 5 rats), Šídák’s: a, b (p = 0.011) and b, c (p = 0.037). (Diii) The average amplitudes for last 5 min of each condition with forskolin (p = 0.037, RM-ANOVA, n = 6 cells, 4 rats), Šídák’s: a, b (p = 0.041) and b, c (p = 0.035). Gray horizontal bars represent the mean ± SEM. Šídák’s post-hoc depicted with asterisks.
Figure 7
Figure 7
5α-pregnane-3α,21-diol-20-one (THDOC) reverses the O-GlcNAc iLTD, mimicking forskolin in CA1 pyramidal cells. (Ai) Normalized data showing average eIPSC amplitude during THDOC (10 min, green) followed by GlcN + TMG (10 min, orange). (Aii) Average THDOC and GlcN + TMG eIPSC amplitude from the original baseline (gray bar, dotted line): 83.4 ± 6.9%, p = 0.153 (THDOC) and 56.9% ± 10.3%, p = 0.016 (GlcN + TMG) and each other (p = 0.093); (p = 0.0032, RM-ANOVA). (Aiii) The average eIPSC amplitudes during the last 5 min of each condition corresponding to a–c in (Ai) (p = 0.0059, RM-ANOVA, n = 7 cells, 7 rats), Šídák’s: a–c (p = 0.032). (Bi) Normalized data showing average eIPSC amplitude during GlcN + TMG (10 min, orange) followed by THDOC (10 min, green). (Bii) Average GlcN + TMG and THDOC eIPSC amplitude from the original baseline (gray bar, dotted line): 72.1% ± 3.3% (GlcN + TMG), p < 0.0001 and 76.7% ± 5.5% (THDOC), p = 0.003 and each other (p = 0.617); (p < 0.0001, RM-ANOVA). (Biii) The average eIPSC amplitudes during the last 5 min of each condition corresponding to a–c in (Bi) (p < 0.0001, RM-ANOVA, n = 12 cells, 12 rats), Šídák’s: a, b (p < 0.0001), a- (p = 0.005). Potentiated: (Ci) Normalized data showing average eIPSC amplitude during GlcN + TMG followed by THDOC. (Cii) Average GlcN + TMG and THDOC eIPSC amplitude from the original baseline (gray bar, dotted line): 75.8% ± 2.6% (GlcN + TMG), p = 0.0002 and 88.6% ± 4.0% (THDOC), p = 0.089 and each other (p = 0.034); (p = 0.0002, RM-ANOVA). (Ciii) Last 5 min average amplitudes corresponding to a–c (p = 0.0003, RM-ANOVA, n = 7 cells, 7 rats), Šídák’s: a, b (p = 0.0002), b, c (p = 0.036). Non-potentiated: (Di) Normalized data showing average eIPSC amplitude during GlcN + TMG followed by THDOC. (Dii) Average GlcN + TMG and THDOC eIPSC amplitude from the original baseline (gray bar, dotted line): 66.9% ± 6.9% (GlcN + TMG), p = 0.026 and 59.9% ± 6.8% (THDOC), p = 0.012 and each other (p = 0.422); (p = 0.0014, RM-ANOVA). (Diii) Last 5 min average amplitudes corresponding to a–c (p = 0.0099, RM-ANOVA, n = 5 cells, 5 rats), Šídák’s: a, b (p = 0.041), a–c (p = 0.025). Inset: overlaid averaged representative eIPSC traces during baseline (black), GlcN + TMG (orange), THDOC (green) (left) and scaled (right). Gray horizontal bars represent mean ± SEM. Šídák’s post-hoc depicted with asterisks.
Figure 8
Figure 8
Progesterone also reverses O-GlcNAc iLTD, mimicking forskolin in CA1 pyramidal cells. (Ai) Normalized data showing average eIPSC amplitude during progesterone (10 min, pink) followed by GlcN + TMG (10 min, orange). (Aii) Average progesterone and GlcN + TMG eIPSC amplitude from the original baseline (gray bar, dotted line): 92.2% ± 7.3% (Progesterone), p = 0.701 and 76.9% ± 9.1% (GlcN + TMG), p = 0.126 (GlcN + TMG) and each other (p = 0.008); (p = 0.047, RM-ANOVA). (Aiii) The average eIPSC amplitudes during the last 5 min of each condition corresponding to a–c in (Ai) (p = 0.0328, RM-ANOVA, n = 7 cells, 7 rats). Šídák’s: b, c (p = 0.008). (Bi) Normalized data showing average eIPSC amplitude during GlcN + TMG (10 min, orange) followed by progesterone (10 min, pink). (Bii) Average GlcN + TMG and progesterone eIPSC amplitude from the original baseline (gray bar, dotted line): 68.7% ± 3.8%, p < 0.001 (GlcN + TMG), and 75.3% ± 4.9% (progesterone), p = 0.0011 and each other (p = 0.428); (p < 0.0001, RM-ANOVA). (Biii) The average eIPSC amplitudes during the last 5 min of each condition corresponding to a–c in (Bi) (p = 0.0007, RM-ANOVA, n = 13 cells, 10 rats) Šídák’s: a, b (p = 0.0004). Potentiated: (Ci) Normalized data showing average eIPSC amplitude during GlcN + TMG followed by progesterone. (Cii) Average GlcN + TMG and progesterone eIPSC amplitude from the original baseline (gray bar, dotted line): 65.9% ± 6.2% (GlcN + TMG), p = 0.0045 and 83.3% ± 7.1% (progesterone), p = 0.175 and each other (p = 0.019); (p = 0.002 RM-ANOVA). (Ciii) Last 5 min average amplitudes corresponding to a–c (p = 0.002, RM-ANOVA, n = 7 cells, 7 rats) Šídák’s: a, b (p = 0.0019), b, c (p = 0.037). Non-potentiated: (Di) Normalized data showing average eIPSC amplitude during GlcN + TMG followed by progesterone. (Dii) Average GlcN + TMG and progesterone on eIPSC amplitude from the original baseline (gray bar, dotted line): 71.8% ± 4.7% (GlcN + TMG), p = 0.006 and 65.9% ± 5.0% (progesterone), p = 0.0031 and each other (p = 0.591); (p < 0.0001, RM-ANOVA). (Diii) Last 5 min average amplitudes corresponding to a–c (p = 0.004, RM-ANOVA, n = 6 cells, 6 rats), Šídák’s: a, b (p = 0.015), a–c (p = 0.0096). Inset: overlaid averaged representative eIPSC traces during baseline (black), GlcN + TMG (orange), progesterone (pink) (left) and scaled (right). Gray horizontal bars represent mean ± SEM. Šídák’s post hoc depicted with asterisks.

Update of

Similar articles

Cited by

References

    1. Jacob, T. C., Moss, S. J. & Jurd, R. GABAA receptor trafficking and its role in the dynamic modulation of neuronal inhibition. Nat. Rev. Neurosci.9, 331–343 (2008). 10.1038/nrn2370 - DOI - PMC - PubMed
    1. Macdonald, R. L., Kang, J.-Q. & Gallagher, M. J. Mutations in GABAA receptor subunits associated with genetic epilepsies. J. Physiol.588, 1861–1869 (2010). 10.1113/jphysiol.2010.186999 - DOI - PMC - PubMed
    1. Liang, J. & Olsen, R. W. Alcohol use disorders and current pharmacological therapies: The role of GABAA receptors. Acta Pharmacol. Sin.35, 981–993 (2014). 10.1038/aps.2014.50 - DOI - PMC - PubMed
    1. Mele, M., Costa, R. O. & Duarte, C. B. Alterations in GABAA-receptor trafficking and synaptic dysfunction in brain disorders. Front. Cell Neurosci.13, 77 (2019). 10.3389/fncel.2019.00077 - DOI - PMC - PubMed
    1. Charych, E. I., Liu, F., Moss, S. J. & Brandon, N. J. GABAA receptors and their associated proteins: Implications in the etiology and treatment of schizophrenia and related disorders. Neuropharmacology57, 481–495 (2009). 10.1016/j.neuropharm.2009.07.027 - DOI - PMC - PubMed

LinkOut - more resources