. 2024 Jul 29;14(1):17423.
doi: 10.1038/s41598-024-67177-5.

Peripheral inflammation is associated with brain atrophy and cognitive decline linked to mild cognitive impairment and Alzheimer's disease

Collaborators, Affiliations

Peripheral inflammation is associated with brain atrophy and cognitive decline linked to mild cognitive impairment and Alzheimer's disease

Nuanyi Liang et al. Sci Rep. .

Abstract

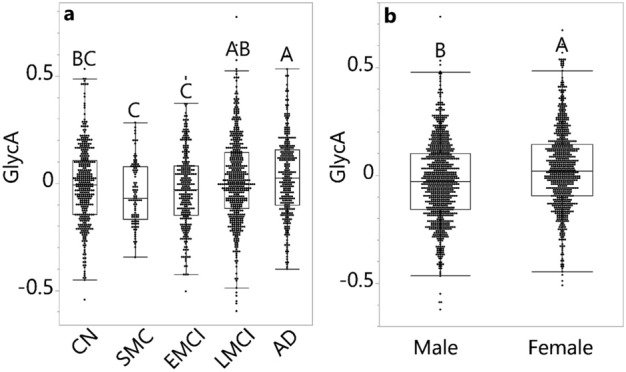
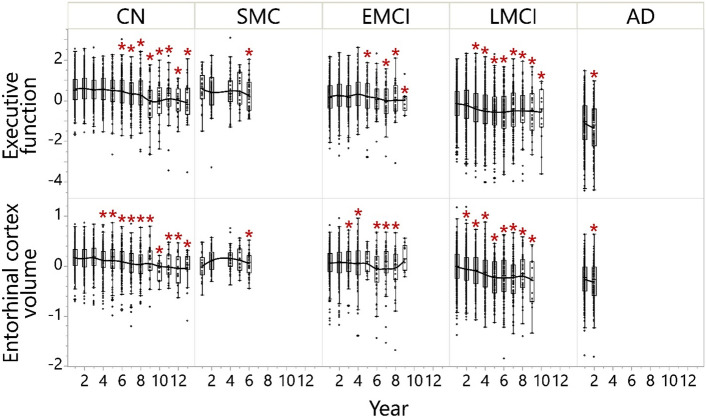
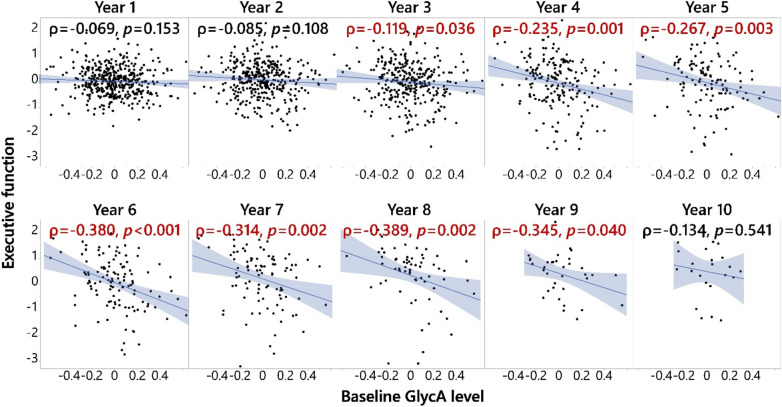
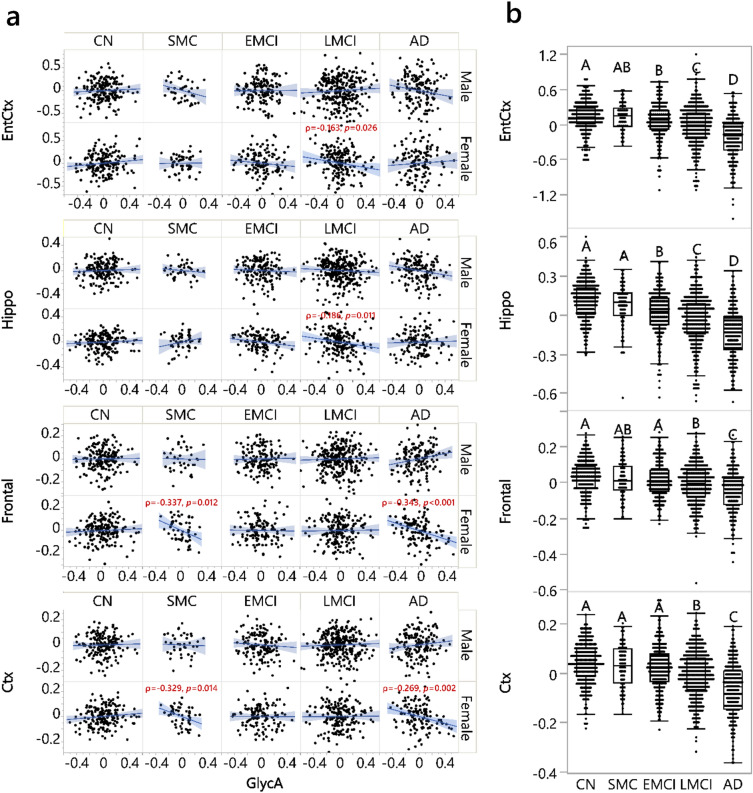
Inflammation is an important factor in Alzheimer's disease (AD). An NMR measurement in plasma, glycoprotein acetyls (GlycA), captures the overall level of protein production and glycosylation implicated in systemic inflammation. With its additional advantage of reducing biological variability, GlycA might be useful in monitoring the relationship between peripheral inflammation and brain changes relevant to AD. However, the associations between GlycA and these brain changes have not been fully evaluated. Here, we performed Spearman's correlation analyses to evaluate these associations cross-sectionally and determined whether GlycA can inform AD-relevant longitudinal measurements among participants in the Alzheimer's Disease Neuroimaging Initiative (n = 1506), with additional linear models and stratification analyses to evaluate the influences of sex or diagnosis status and confirm findings from Spearman's correlation analyses. We found that GlycA was elevated in AD patients compared to cognitively normal participants. GlycA correlated negatively with multiple concurrent regional brain volumes in females diagnosed with late mild cognitive impairment (LMCI) or AD. Baseline GlycA level was associated with executive function decline at 3-9 year follow-up in participants diagnosed with LMCI at baseline, with similar but not identical trends observed in the future decline of memory and entorhinal cortex volume. Results here indicated that GlycA is an inflammatory biomarker relevant to AD pathogenesis and that the stage of LMCI might be relevant to inflammation-related intervention.

Keywords: Alzheimer’s disease; Brain atrophy; GlycA; Inflammation; Inflammatory biomarker; Metabolomics; Mild cognitive impairment; Peripheral-central connection; Population heterogeneity; Sex differences.


Conflict of interest statement

Dr. Rima Kaddurah-Daouk and Dr. Matthias Arnold participated in the invention of several patents on applying metabolomics to diagnose and treat CNS diseases. Dr. Kaddurah-Daouk holds equity in Metabolon Inc., Chymia LLC and PsyProtix, which were not involved in the current study. Dr. Arnold holds equity in Chymia LLC and IP in PsyProtix. All other authors declare that they have no competing interests.

Figures

Figure 1
Figure 1
GlycA levels in ADNI participants. GlycA level in (a) groups of various diagnosis statuses, adjusted for sex and (b) sexes, adjusted by diagnosis status. (a) GlycA level was log2-transformed and adjusted for medications, sex, age, APOE4, BMI, and education level. (b) GlycA level was log2-transformed and adjusted for medications, diagnosis status, age, APOE4, BMI, and education level. ANCOVA and Tukey HSD post hoc analysis were performed; levels not labeled with the same letter differed significantly (p < 0.05) (e.g., the groups in the same figure labeled with A and B were significantly different from each other, but the ones labeled with A and AB were not significantly different). Values in the bar graph were shown as the mean residual GlycA level ± standard error. There was no sex-diagnosis status interaction in a full factorial model. AD: Alzheimer’s disease; ANCOVA: Analysis of covariance; BMI: Body mass index; CN: Cognitively normal; EMCI: Early mild cognitive impairment; GlycA: Glycoprotein acetyls; HSD: Honestly significant difference; LMCI: Late mild cognitive impairment; SMC: Significant memory concerns.
Figure 2
Figure 2
Executive function and entorhinal cortex volume decline in ADNI participants. Participants diagnosed with LMCI at baseline started to have the most continuous executive functional decline on and after 3-year follow-up and continuous entorhinal cortex volume decline on and after 2-year follow-up, which was well distinguished from CN participants and participants with SMC and EMCI. Executive function was executive function score adjusted for sex, APOE4, education, BMI at visit and age at screening. The ANCOVA results comparing different time points within each diagnosis group are shown in the heatmap of Fig. S3; the ANCOVA results comparing EF of different diagnoses at baseline are shown in Fig. S4. Entorhinal cortex volume was entorhinal cortex volume adjusted for intracranial volume (log2), magnet type, sex, APOE4, education, BMI at visit and age at screening. The ANCOVA results comparing different time points within each diagnosis group are shown in the heatmap of Fig. S7; the ANCOVA results comparing the entorhinal cortex volume of different diagnoses at baseline are shown in Fig. 5. Results annotated with * were at a significantly different level compared to Year 1 within the diagnosis group (Figs. S3 and S7). AD: Alzheimer’s disease; ANCOVA: Analysis of covariance; BMI: Body mass index; CN: Cognitively normal; EMCI: Early mild cognitive impairment; LMCI: Late mild cognitive impairment; SMC: Significant memory concerns.
Figure 3
Figure 3
Baseline GlycA level associated with future executive function declines in LMCI patients. Baseline GlycA level was associated with executive function composite score (EF) declines in late mild cognitive impairment (LMCI) patients at 3–9 years of follow-up. Spearman’s rank order correlation was performed on residuals of EF and GlycA, and the analyses were stratified by diagnosis status. EF at different years were adjusted for baseline EF level, screening age, follow-up year, BMI at the time, APOE4, sex, and education, treating participant ID as random factors; baseline GlycA level was log2-transformed and adjusted for medication, screening age, baseline BMI, APOE4, sex, and education. All significant results shown in the figure passed FDR correction using the Benjamini and Hochberg method (q = 0.2). The analysis was performed on participants with different diagnosis statuses (Table S3), but only in the participants with LMCI was EF at continuous follow-up years negatively associated with baseline GlycA level and thus shown here. In addition, the LMCI-GlycA interaction was confirmed using a linear mixed model (p = 0.025, Table S4). Therefore, the analysis results for the participants with LMCI are shown here. A full factorial linear mixed model was used to show that there were no sex-GlycA interactions controlling DX (p = 0.864). BMI: Body mass index; DX: Diagnosis at baseline; GlycA: Glycoprotein acetyls; ID: Identification.
Figure 4
Figure 4
Baseline GlycA level associated with future entorhinal cortex volume declines in LMCI patients. Baseline GlycA level was associated with entorhinal cortex volume declines in late mild cognitive impairment (LMCI) patients at the 2nd, 4th, and 6–8th years of follow-up. Spearman’s rank order correlation was performed on residuals of entorhinal cortex volume and GlycA, and the analyses were stratified by diagnosis status. Entorhinal cortex volume at different years was adjusted for baseline entorhinal cortex volume, screening age, follow-up year, BMI at the time, APOE4, sex, and education, treating participant ID as random factors (all MRI volumes were log2-transformed and adjusted for intracranial volume and magnet type); baseline GlycA level was log2-transformed and adjusted for medication, screening age, baseline BMI, APOE4, sex, and education. All significant results shown in the figure passed FDR correction using the Benjamini and Hochberg method (q = 0.2). The analysis was performed on participants with different diagnosis statuses (Table S6), but only in the participants with LMCI was entorhinal cortex volume in three continuous follow-up years negatively associated with baseline GlycA level. Therefore, the analysis results for the participants with LMCI are shown here. In addition, the LMCI-GlycA interaction was confirmed with a linear mixed model (p = 0.005, Table S4). A similar full factorial linear mixed model was used to show that there were no sex-GlycA interactions controlling DX (p = 0.564). BMI: Body mass index; DX: Diagnosis at baseline; GlycA: Glycoprotein acetyls; ID: Identification; MRI: Magnetic resonance imaging.
Figure 5
Figure 5
GlycA cross-sectionally associated with regional brain volumes in females with SMC, LMCI and AD. The full results are listed in Tables S7 and S9 and the present figure illustrates selected representative examples. (a) Significant associations were found between GlycA and volumetric measurements of brain regions, i.e., entorhinal cortex (EntCtx), hippocampus (Hippo), frontal lobe (Frontal), and cerebral cortex grey matter (Ctx). Spearman’s rank order correlation was performed between the residual of GlycA (log2-transformed, adjusted for medications, APOE4, age, BMI, and education) and residuals of whole brain regional volumes (log2-transformed, adjusted for log2-intracranial volume, magnet strength/scan type, APOE4, age, BMI, education); the analysis was performed stratified by sex and diagnosis groups. All significant results shown in the figure passed FDR correction using the Benjamini and Hochberg method (q = 0.2). (b) This panel indicates different levels of these brain volumetric measurements, adjusting for the same confounders without stratifications (Table S9). There were no significant sex-diagnosis stages interactions (pinteraction = 0.284 (EntCtx), 0.244 (Hippo), 0.324 (Frontal) and 0.398 (Ctx)) for brain volumetric measurements and therefore this panel is not divided by sex. N: for males: CN: 178, SMC: 40, EMCI: 154, LMCI: 292, and AD: 154; for females: CN: 183, SMC: 55, EMCI: 125, LMCI: 187, and AD: 131. AD: Alzheimer’s disease; ANCOVA: Analysis of covariance; BMI: Body mass index; CN: Cognitively normal; EMCI: Early mild cognitive impairment; GlycA: Glycoprotein acetyls; LMCI: Late mild cognitive impairment; SMC: Significant memory concerns.

References

    1. Kinney, J.W., Bemiller, S.M., Murtishaw, A.S., Leisgang, A.M., Salazar, A.M., Lamb, B.T. Inflammation as a central mechanism in Alzheimer’s disease. 2018 (2352–8737 (Electronic)). - PMC - PubMed
    1. Arvanitakis, Z., Wilson, R. S., Bienias, J. L., Evans, D. A. & Bennett, D. A. Diabetes mellitus and risk of Alzheimer disease and decline in cognitive function. Arch Neurol.61(5), 661–666 (2004). 10.1001/archneur.61.5.661 - DOI - PubMed
    1. Kalaria, R. N., Akinyemi, R. & Ihara, M. Does vascular pathology contribute to Alzheimer changes?. J. Neurol. Sci.322(1), 141–147 (2012). 10.1016/j.jns.2012.07.032 - DOI - PubMed
    1. Hofman, A. et al. Atherosclerosis, apolipoprotein E, and prevalence of dementia and Alzheimer’s disease in the Rotterdam Study. Lancet.349(9046), 151–154 (1997). 10.1016/S0140-6736(96)09328-2 - DOI - PubMed
    1. Skoog, I. et al. 15-year longitudinal study of blood pressure and dementia. Lancet.347(9009), 1141–1145 (1996). 10.1016/S0140-6736(96)90608-X - DOI - PubMed