. 2024 Jul 29;14(1):17442.
doi: 10.1038/s41598-024-68532-2.

Tracking EEG network dynamics through transitions between eyes-closed, eyes-open, and task states

Affiliations

Tracking EEG network dynamics through transitions between eyes-closed, eyes-open, and task states

Paweł Krukow et al. Sci Rep. .

Abstract

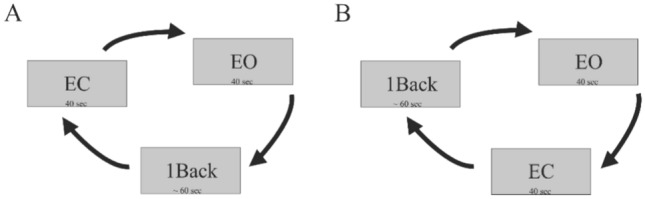
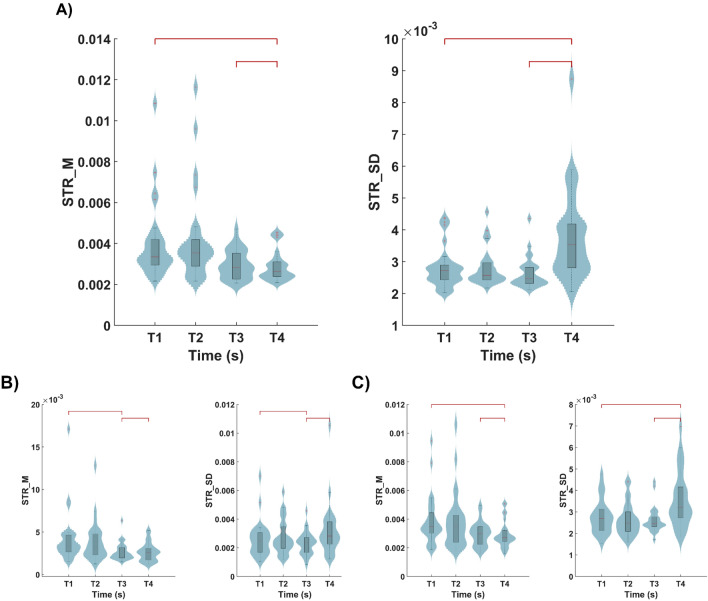
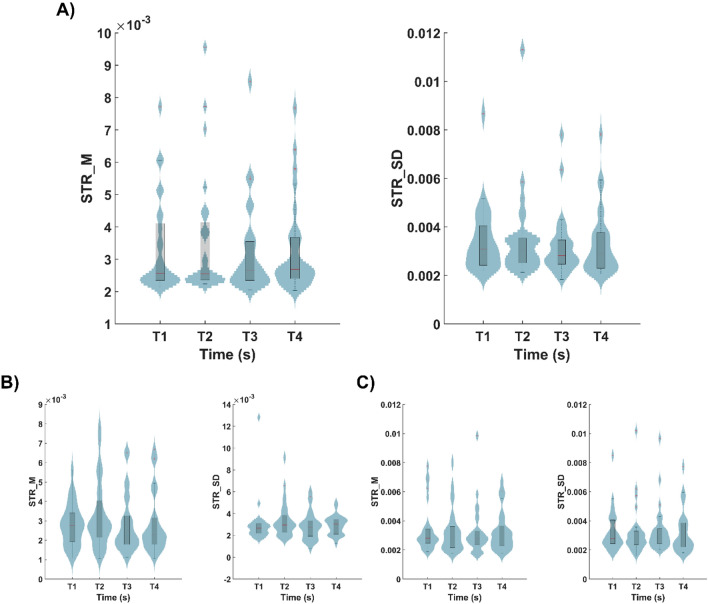
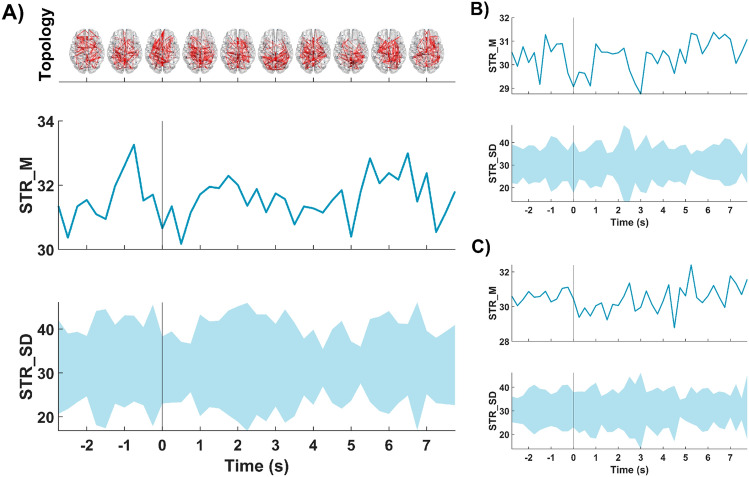
Our study aimed to verify the possibilities of effectively applying chronnectomics methods to reconstruct the dynamic processes of network transition between three types of brain states, namely, eyes-closed rest, eyes-open rest, and a task state. The study involved dense EEG recordings and reconstruction of the source-level time-courses of the signals. Functional connectivity was measured using the phase lag index, and dynamic analyses concerned coupling strength and variability in alpha and beta frequencies. The results showed significant and dynamically specific transitions regarding processes of eyes opening and closing and during the eyes-closed-to-task transition in the alpha band. These observations considered a global dimension, default mode network, and central executive network. The decrease of connectivity strength and variability that accompanied eye-opening was a faster process than the synchronization increase during eye-opening, suggesting that these two transitions exhibit different reorganization times. While referring the obtained results to network studies, it was indicated that the scope of potential similarities and differences between rest and task-related networks depends on whether the resting state was recorded in eyes closed or open condition.

Keywords: Chronnectomics; Default mode network; EEG; Functional connectivity; Neural networks.


Conflict of interest statement

The authors declare no competing interests.

Figures

Figure 1
Figure 1
Illustration of the experimental procedure with two blocks. Each arrow indicates analyzed transitions between a given state.
Figure 2
Figure 2
Flow diagram of the employed methodology to assess the functional connectivity in the assessed transitions. Preprocessing—The artifacts are removed from the EEG signals, and their source-level time courses are reconstructed. Segmentation—The signals are segmented between − 3 and + 8 s, with the 0 s being the moment when the transition between conditions is indicated. Estimation of the FC—For every trial (extracted in the previous step), and band (alpha and beta) the FC is estimated by means of PLI metric employing a 500 ms sliding window with an overlapping of 50%.
Figure 3
Figure 3
Evolution across time of the STR_M and STR_SD for: (A) global neural network, (B) DMN and (C) CEN. Within each section, in the upper row it is depicted the evolution of the STR_M, and in the lower row the evolution of the STR_SD during the ECEO transition in the alpha band. The transition between both states is marked with a vertical line (i.e., 0 s). Moreover, for the global neural network, the evolution of the topology during the transition is depicted in the upper part of the section (A).
Figure 4
Figure 4
(A) Data distribution of the global network STR_M, and STR_SD during the ECEO transition in the alpha band. Analogous comparisons for the results regarding DMN and CEN are depicted in sections (B,C), respectively. Within each panel, the boxplots group the FC values of a different time range: from − 3 to − 1.5 s (T1), from − 1.5 to 0 s (T2), from 0 to 1.5 s (T3), and from 3 to 4.5 s (T4). The statistically significant differences (p-value < 0.05, corrected Wilcoxon signed-rank test) are indicated with dark red lines.
Figure 5
Figure 5
Evolution across time of the STR_M and STR_SD for: (A) global neural network, (B) DMN and (C) CEN. Within each section, in the upper row it is depicted the evolution of the STR_M, and in the lower row the evolution of the STR_SD during the EOEC transition in the alpha band. The transition between both states is marked with a vertical line (i.e., 0 s). Moreover, for the global neural network, the evolution of the topology during the transition is depicted in the upper part of the section (A).
Figure 6
Figure 6
(A) Data distribution of the global network STR_M, and STR_SD during the EOEC transition in the alpha band. Analogous comparisons for the results regarding DMN and CEN are depicted in sections (B,C), respectively. Within each panel, the boxplots group the FC values of a different time range: from − 3 to − 1.5 s (T1), from − 1.5 to 0 s (T2), from 0 to 1.5 s (T3), and from 3 to 4.5 s (T4). The statistically significant differences (p-value < 0.05, corrected Wilcoxon signed-rank test) are indicated with dark red lines.
Figure 7
Figure 7
Evolution across time of the STR_M and STR_SD for: (A) global neural network, (B) DMN and (C) CEN. Within each section, in the upper row it is depicted the evolution of the STR_M, and in the lower row the evolution of the STR_SD during the EO1Back transition in the alpha band. The transition between both states is marked with a vertical line (i.e., 0 s). Moreover, for the global neural network, the evolution of the topology during the transition is depicted in the upper part of the section (A).
Figure 8
Figure 8
(A) Data distribution of the global network STR_M, and STR_SD during the EO1Back transition in the alpha band. Analogous comparisons for the results regarding DMN and CEN are depicted in sections (B,C), respectively. Within each panel, the boxplots group the FC values of a different time range: from − 3 to − 1.5 s (T1), from − 1.5 to 0 s (T2), from 0 to 1.5 s (T3), and from 3 to 4.5 s (T4).
Figure 9
Figure 9
Evolution across time of the STR_M and STR_SD for: (A) global neural network, (B) DMN and (C) CEN. Within each section, in the upper row it is depicted the evolution of the STR_M, and in the lower row the evolution of the STR_SD during the 1BackEO transition in the alpha band. The transition between both states is marked with a vertical line (i.e., 0 s). Moreover, for the global neural network, the evolution of the topology during the transition is depicted in the upper part of the section (A).
Figure 10
Figure 10
(A) Data distribution of the global network STR_M, and STR_SD during the 1BackEO transition in the alpha band. Analogous comparisons for the results regarding DMN and CEN are depicted in sections (B,C), respectively. Within each panel, the boxplots group the FC values of a different time range: from − 3 to − 1.5 s (T1), from − 1.5 to 0 s (T2), from 0 to 1.5 s (T3), and from 3 to 4.5 s (T4).

Similar articles

Cited by

References

    1. Hasson, U., Nusbaum, H. C. & Small, S. L. Task-dependent organization of brain regions active during rest. Proc. Natl. Acad. Sci. USA106(26), 10841–10846 (2009). 10.1073/pnas.0903253106 - DOI - PMC - PubMed
    1. Di, X., Gohel, S., Kim, E. H. & Biswal, B. B. Task versus rest-different network configurations between the coactivation and the resting-state brain networks. Front. Hum. Neurosci.7, 493. 10.3389/fnhum.2013.00493 (2013). 10.3389/fnhum.2013.00493 - DOI - PMC - PubMed
    1. Sadaghiani, S., Poline, J. B., Kleinschmidt, A. & D’Esposito, M. Ongoing dynamics in large-scale functional connectivity predict perception. Proc. Natl. Acad. Sci. USA112(27), 8463–8468 (2015). 10.1073/pnas.1420687112 - DOI - PMC - PubMed
    1. Reed, M. B. et al. Serotonergic modulation of effective connectivity in an associative relearning network during task and rest. NeuroImage249, 118887. 10.1016/j.neuroimage.2022.118887 (2022). 10.1016/j.neuroimage.2022.118887 - DOI - PubMed
    1. Shine, J. M. & Poldrack, R. A. Principles of dynamic network reconfiguration across diverse brain states. Neuroimage180(Pt B), 396–405 (2018). 10.1016/j.neuroimage.2017.08.010 - DOI - PubMed

LinkOut - more resources