. 2024 Jul 29;14(1):17365.
doi: 10.1038/s41598-024-67930-w.

Resilience of soybean genotypes to drought stress during the early vegetative stage

Affiliations

Resilience of soybean genotypes to drought stress during the early vegetative stage

Nisarga Kodadinne Narayana et al. Sci Rep. .

Abstract

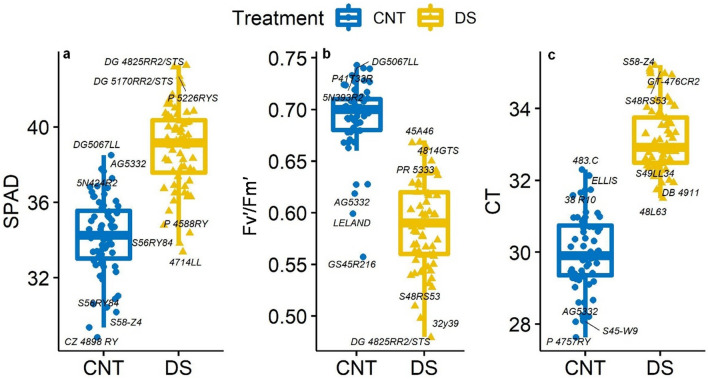
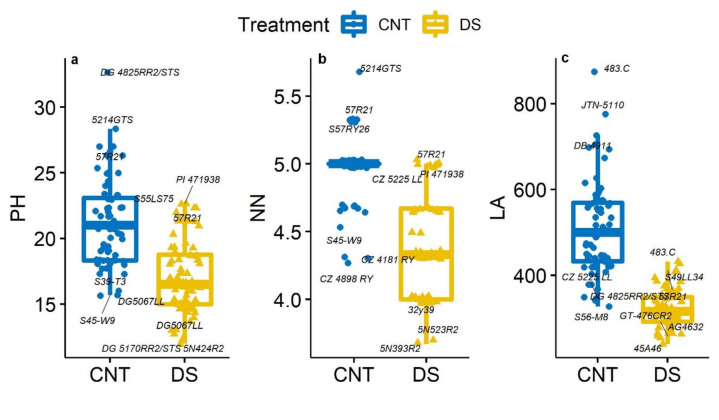
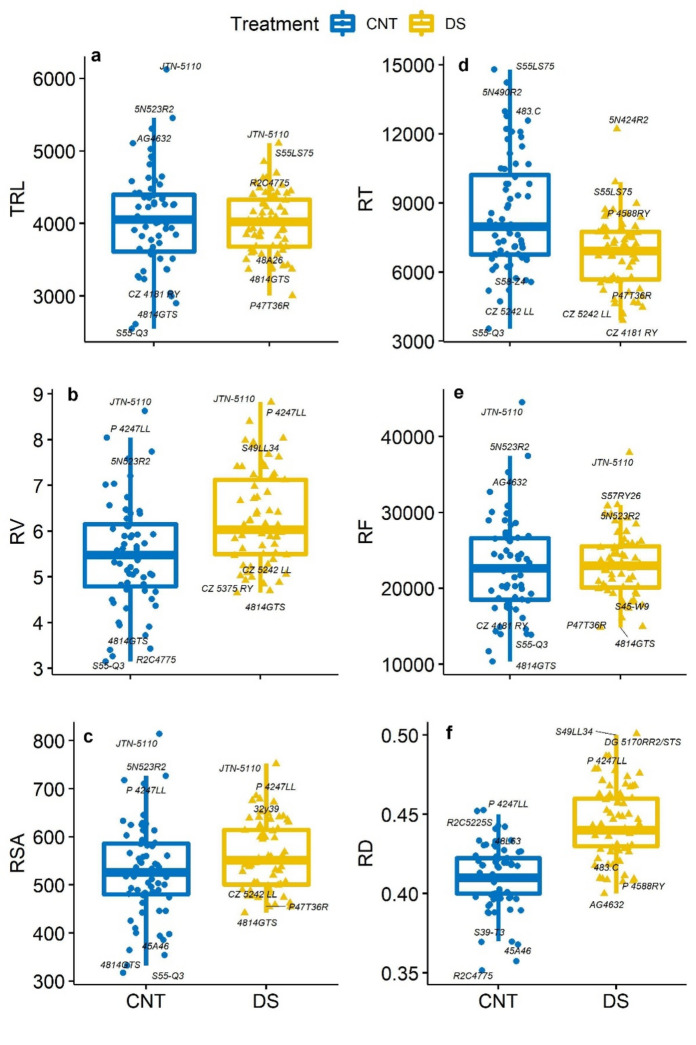
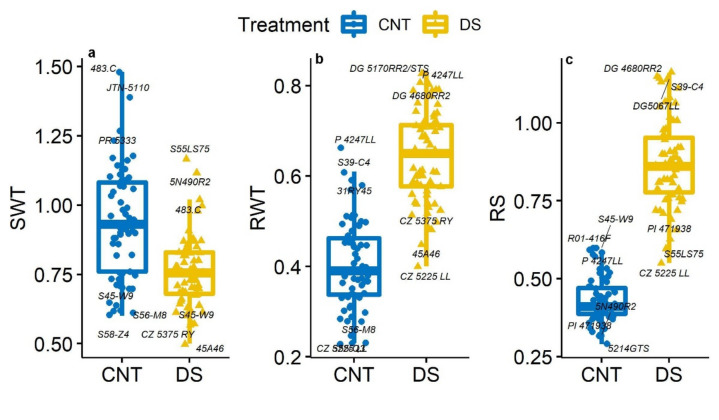
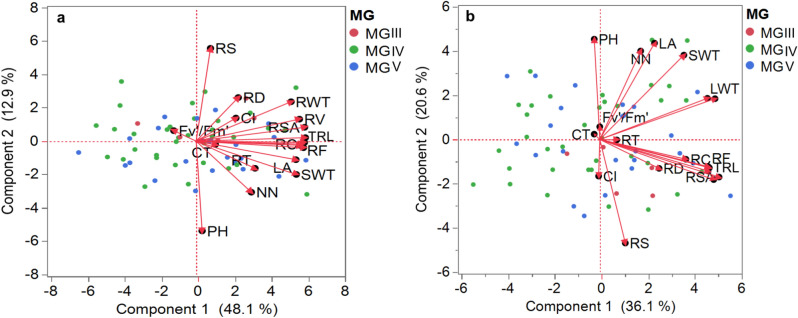
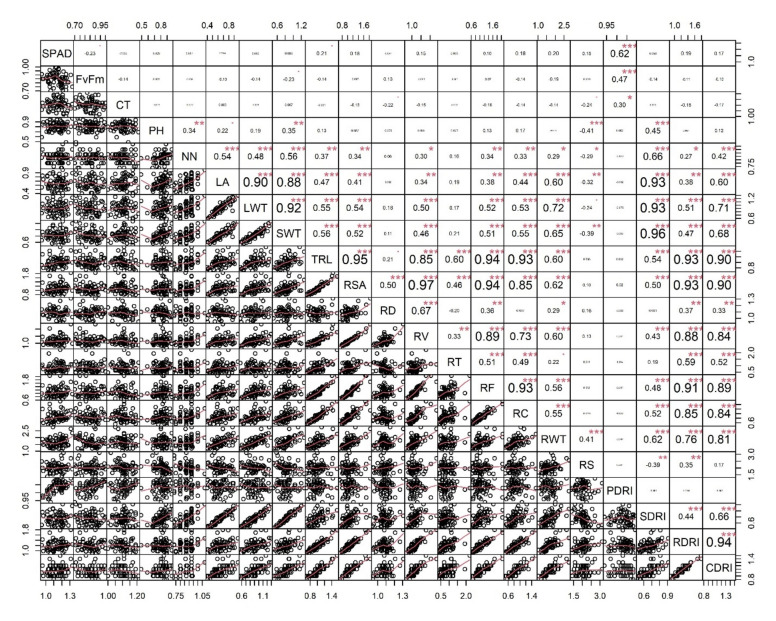
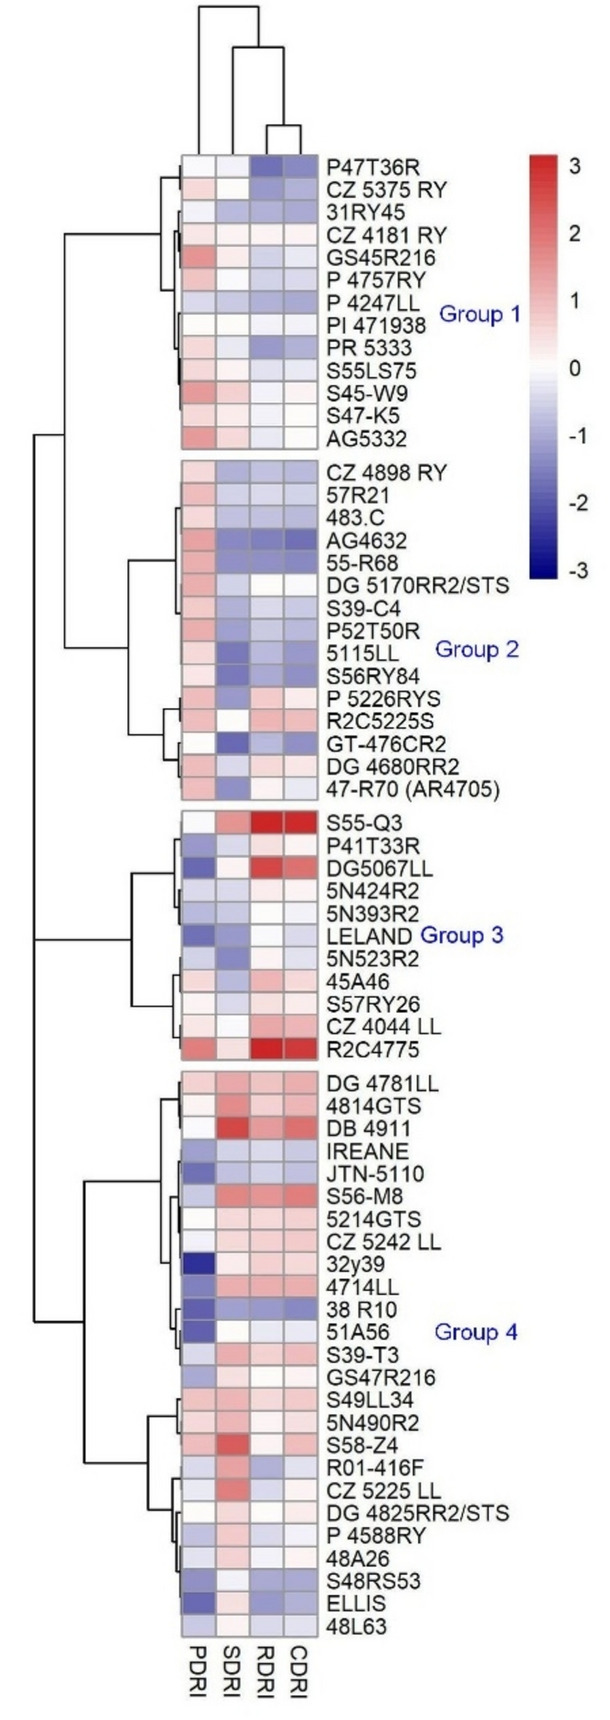
Drought stress poses a significant risk to soybean production, as it relies on optimum rainfall under rainfed conditions. Exposure to brief dry periods during early vegetative growth impacts soybean growth and development. Choosing a genotype that can withstand stress with minimal impact on physiology and growth might help sustain biomass or yields under low rainfall conditions. Therefore, this study characterized 64 soybean genotypes for traits associated with drought tolerance during the early vegetative stage under two soil moisture treatments, 100% evapotranspiration (well-watered) and 50% evapotranspiration (drought), using the Soil-Plant-Atmosphere Research (SPAR) units. Eighteen morpho-physiological traits responses were assessed, and their relationship with the early vegetative drought tolerance was investigated. Drought stress significantly increased root weight, root volume, and root-to-shoot ratio but reduced shoot weight. Drought-stressed plants increased the canopy temperature by 3.1 °C. Shoot weight positively correlated with root surface area (r = 0.52, P < 0.001) and root weight (r = 0.65, P < 0.001). There was a strong negative correlation between shoot weight and root-to-shoot ratio (P < 0.01). Further, the combined drought response index was strongly associated with the root response index and weakly with the physiological response index. These findings suggest that genotypes (S55-Q3 and R2C4775) with high above-ground biomass with a balanced root-to-shoot ratio improves drought tolerance during the early vegetative. These genotypes could serve as valuable genetic resources to dissect the molecular networks underlying drought tolerance and ultimately be used in breeding programs to improve root ability at the early vegetative stage.


Conflict of interest statement

The authors declare no competing interests.

Figures

Figure 1
Figure 1
Boxplots showing the differences in chlorophyll index (SPAD, a), chlorophyll fluorescence (Fv′/Fm′, b), and canopy temperature (CT °C, c) of 64 soybean genotypes under control (CNT) and drought (DS). The whiskers indicate the interquartile range, and the outer dots are outliers. The middle line represents the mean of the 64 genotypes, and the box shows the range of the 25th–75th percentiles of the data.
Figure 2
Figure 2
Effect of drought on plant height (PH, cm; a), number of nodes (NN, b), and leaf area (LA, cm2 plant−1; c) of 64 soybean genotypes. The measurements were taken at 22 days after stress was initiated. The middle line represents the mean of the 64 genotypes, and the box shows the range of the 25th–75th percentiles of the data. The whiskers indicate the interquartile range, and the outer dots are outliers. CNT and DS denote control and drought stress, respectively.
Figure 3
Figure 3
Effect of drought on total root length (cm plant−1; a), root volume (RV, cm3 plant−1; b), root surface area (RSA, cm2 plant−1; c), root tips (RT, no. plant−1; d), root forks (no. plant−1; e) and root diameter (RD, cm; f) of 64 soybean genotypes. The measurements were taken at 22 days after stress was initiated. The middle line represents the mean of the 64 genotypes, and the box shows the range of the 25th–75th percentiles of the data. The whiskers indicate the interquartile range, and the outer dots are outliers. CNT and DS denote control and drought stress, respectively.
Figure 4
Figure 4
Drought impact on shoot weight (SWT, g plant−1; a), root weight (RWT, g plant-1; b), and root-to-shoot ratio (RS; c) of 64 soybean genotypes. The measurements were taken at 22 days after stress initiation. The middle line represents the mean of the 64 genotypes, and the box shows the range of the 25th to 75th percentiles of the data. The whiskers indicate the interquartile range, and the outer dots are outliers. CNT and DS denote control and drought stress, respectively.
Figure 5
Figure 5
Principle component (PC) analysis for morphological and physiological traits of 64 soybean genotypes in maturity groups (MG) III, IV, and V under control (a) and drought stress (b). Acronyms are given in Table 1.
Figure 6
Figure 6
Pearson correlation matrix among 64 soybean genotypes using drought response index. Correlations values with ± indicate a strong relationship between two traits. Asterisks (*, **, ***) indicate significance at P < 0.05, P < 0.01, and P < 0.001, respectively; correlation coefficients without asterisks were not significant. PDRI—physiological drought response index, SDRI—shoot drought response index, RDRI—root drought response index, and CDRI indicats the cumulative drought response index. Acronyms are given in Table 1.
Figure 7
Figure 7
Grouping of soybean genotypes based on drought response index values using a hierarchical clustering method. Each dark red and dark blue column indicates a trait's top and least performing genotypes, respectively. Each column represents the average drought indices (PDRI, SDRI, RDRI, and CDRI; see statistical analysis section). Each row represents a genotype. Acronyms are given in Table 1.

References

    1. United States Department of Agriculture (USDA)—World Agricultural Production. Available online: https://apps.fas.usda.gov/psdonline/circulars/production.pdf (Retrieved on 25 Oct 2023).
    1. Vasudevan, P. T. & Briggs, M. Biodiesel production—Current state of the art and challenges. J. Ind. Microbiol. Biotechnol.35, 421 (2008). 10.1007/s10295-008-0312-2 - DOI - PubMed
    1. Statista, 2023. https://www.statista.com/statistics/612557/soybean-oil-production-worldw... (Retrieved on 25 Oct 2023).
    1. Rubiales, D. & Mikic, A. Introduction: legumes in sustainable agriculture. Crit. Rev. Plant Sci.34, 2 (2015).10.1080/07352689.2014.897896 - DOI
    1. Van Dingenen, R. et al. The global impact of ozone on agricultural crop yields under current and future air quality legislation. Atmos. Environ.43, 604–618 (2009).10.1016/j.atmosenv.2008.10.033 - DOI

LinkOut - more resources