. 2024 Dec;20(12):1640-1649.
doi: 10.1038/s41589-024-01668-4. Epub 2024 Jul 29.

Template-assisted covalent modification underlies activity of covalent molecular glues

Affiliations

Template-assisted covalent modification underlies activity of covalent molecular glues

Yen-Der Li et al. Nat Chem Biol. 2024 Dec.

Abstract

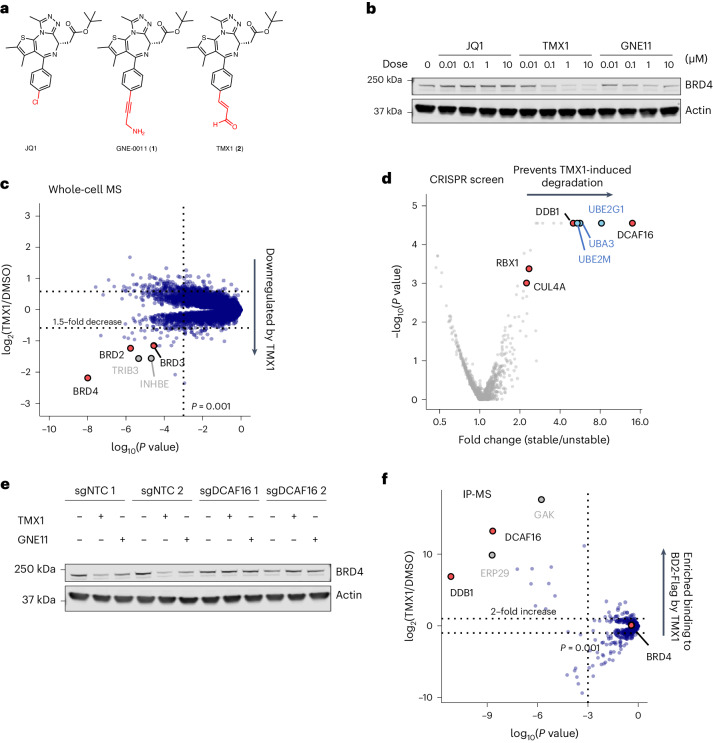
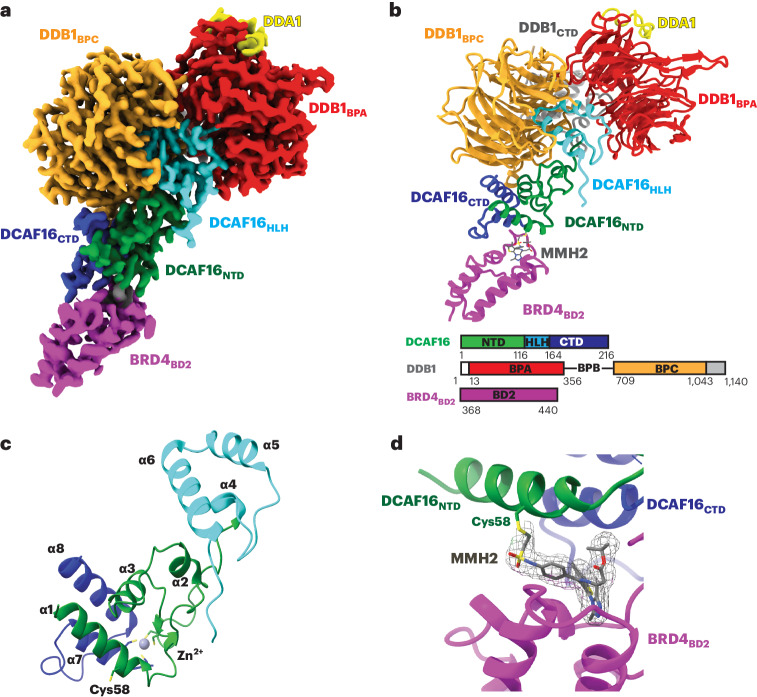
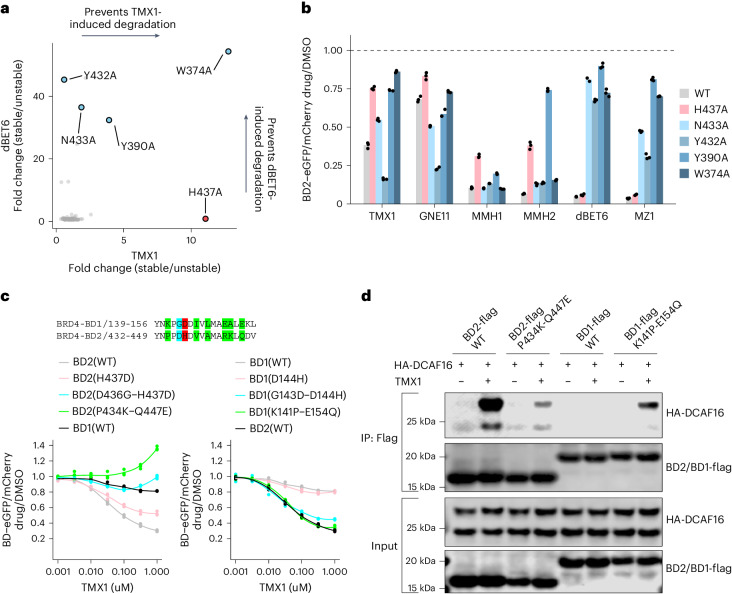
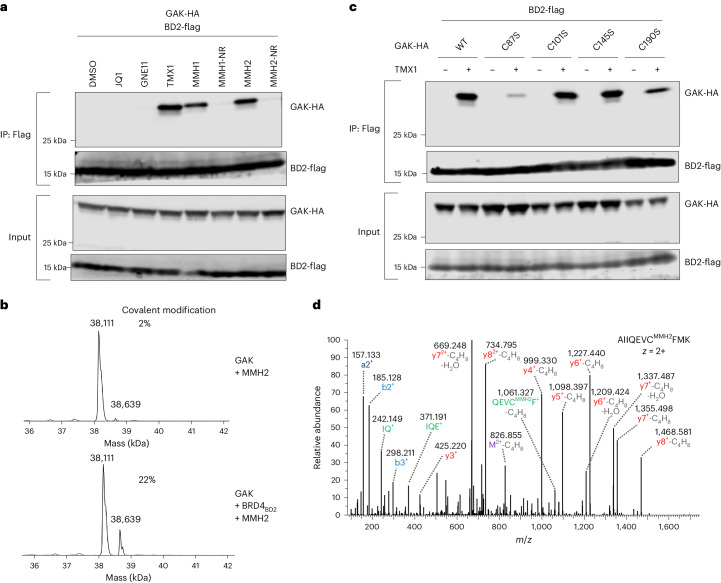
Molecular glues are proximity-inducing small molecules that have emerged as an attractive therapeutic approach. However, developing molecular glues remains challenging, requiring innovative mechanistic strategies to stabilize neoprotein interfaces and expedite discovery. Here we unveil a trans-labeling covalent molecular glue mechanism, termed 'template-assisted covalent modification'. We identified a new series of BRD4 molecular glue degraders that recruit CUL4DCAF16 ligase to the second bromodomain of BRD4 (BRD4BD2). Through comprehensive biochemical, structural and mutagenesis analyses, we elucidated how pre-existing structural complementarity between DCAF16 and BRD4BD2 serves as a template to optimally orient the degrader for covalent modification of DCAF16Cys58. This process stabilizes the formation of BRD4-degrader-DCAF16 ternary complex and facilitates BRD4 degradation. Supporting generalizability, we found that a subset of degraders also induces GAK-BRD4BD2 interaction through trans-labeling of GAK. Together, our work establishes 'template-assisted covalent modification' as a mechanism for covalent molecular glues, which opens a new path to proximity-driven pharmacology.


Conflict of interest statement

Competing interests: B.L.E. has received research funding from Celgene, Deerfield, Novartis and Calico Life Sciences and consulting fees from AbbVie. He is a member of the scientific advisory board (SAB) for and a shareholder of Neomorph, Inc., TenSixteen Bio, Skyhawk Therapeutics and Exo Therapeutics. E.S.F. is a founder, SAB member and equity holder of Civetta Therapeutics, Lighthorse Therapeutics, Proximity Therapeutics and Neomorph, Inc. (board of directors). He is an equity holder in and SAB member for Avilar Therapeutics and Photys Therapeutics and a consultant to Novartis, Sanofi, EcoR1 Capital and Deerfield. The Fischer laboratory receives or has received research funding from Deerfield, Novartis, Ajax, Interline and Astellas. N.S.G. is a founder, SAB member and equity holder in Syros, C4, Allorion, Lighthorse, Voronoi, Inception, Matchpoint, CobroVentures, GlaxoSmithKline, Larkspur (board member), Shenandoah (board member) and Soltego (board member). The Gray laboratory receives or has received research funding from Novartis, Takeda, Astellas, Taiho, Jansen, Kinogen, Arbella, Deerfield, Springworks, Interline and Sanofi. M.S. has received research funding from Calico Life Sciences. K.A.D. receives or has received consulting fees from Kronos Bio and Neomorph, Inc. J.Q. is an equity holder of Epiphanes and Talus Bioscience and receives or has received research funding from Novartis. J.A.M. is a founder and equity holder of and advisor to Entact Bio, serves on the SAB of 908 Devices and receives or has received sponsored research funding from Vertex, AstraZeneca, Taiho, Springworks, TUO Therapeutics and Bruker. Y.-D.L. is currently employed by Leerink Partners. M.W.M. is currently employed by Novartis Venture Fund. K.P. is currently employed by AbbVie. R.J.L. is currently employed by Flagship Pioneering. B.J.G. is currently employed by Blueprint Medicines. I.Y. is currently employed by Matchpoint Therapeutics. The remaining authors declare no competing interests.

Figures

Fig. 1
Fig. 1. JQ1-derived compounds degrade BRD4 via DCAF16.
a, Chemical structures of JQ1, GNE11 and TMX1. b, Western blots of BRD4 degradation in K562 cells treated with DMSO or different concentrations of JQ1, TMX1 and GNE11 for 16 h. c, Quantitative whole proteome analysis of K562 cells after treatment with TMX1 at 0.5 μM (n = 2) or DMSO (n = 3) for 5 h. Statistical analysis was performed using a two-sided moderated t-test as implemented in the limma package. d, UPS-focused CRISPR degradation screen for BRD4BD2-eGFP stability in K562–Cas9 cells treated with TMX1 at 1 μM for 16 h (n = 2). Statistical analysis was performed using a two-sided empirical rank-sum test. e, Western blots of BRD4 degradation in DCAF16 and non-targeting control (NTC) sgRNA-infected K562–Cas9 cells treated with DMSO, TMX1 at 1 μM or GNE11 at 1 μM for 16 h. f, Flag IP followed by mass spectrometry in 293T cells overexpressing BRD4BD2-Flag of cells treated with either MLN4924 plus TMX1 both at 1 μM (n = 4) or MLN4924 at 1 μM only (n = 4). Fold enrichment and P values were calculated by comparing TMX1/MLN4924-treated samples to MLN4924-only control samples. Statistical analysis was performed using a two-sided moderated t-test as implemented in the limma package. All western blot data are representative of two independent measurements. Source data
Fig. 2
Fig. 2. Template-assisted covalent modification of DCAF16 and degraders with optimized electrophilic warheads.
a, TR-FRET signal for DDB1–DCAF16–BODIPY to BRD4BD1-terbium or BRD4BD2-terbium with increasing concentrations of TMX1 (n = 3). b, Intact protein mass spectra of DDB1–DCAF16 alone, DDB1–DCAF16 co-incubated with TMX1 at 4 °C for 16 h or DDB1–DCAF16 co-incubated with TMX1 and BRD4BD2 at 4 °C for 16 h. c, Chemical structures of MMH1, MMH2, MMH1-NR and MMH2-NR. d, Western blot of BRD4 degradation in K562 cells that were treated with DMSO or different concentrations of MMH1, MMH2, dBET6 or MZ1 for 6 h. e, TR-FRET signal for DDB1–DCAF16–BODIPY to BRD4BD2-terbium with increasing concentrations of JQ1, MMH1, MMH2, MMH1-NR and MMH2-NR (n = 3). f, Western blots of BRD4 degradation in K562 cells that were treated with DMSO or different concentrations of MMH1, MMH1-NR, MMH2 or MMH2-NR for 16 h. All western blot data are representative of two independent measurements. Source data
Fig. 3
Fig. 3. BRD4BD2 orients MMH2 for DCAF16 modification.
a, 2.2-Å cryo-EM map of the DDB1ΔB–DDA1–DCAF16–BRD4BD2–MMH2 complex, colored to indicate DDB1BPA (red), DDB1BPC (orange), DDB1CTD (gray), DDA1 (yellow), DCAF16CTD (blue), DCAF16NTD (green), DCAF16HLH (cyan) and BRD4BD2 (magenta). The map shown was processed with DeepEMhancer. b, Cartoon representation of the DDB1–DCAF16 ligase complex bound to BRD4BD2 and MMH2 with same coloring as the cryo-EM map. A sequence scheme for all complex partners is shown at the bottom. c, Cartoon representation of DCAF16 indicating secondary structure elements. d, Close-up of MMH2 covalently modifying DCAF16Cys58 with cryo-EM density around MMH2 shown as mesh.
Fig. 4
Fig. 4. DCAF16Cys58 is targeted by molecular glue degraders.
a, Correlation of fold change for two DCAF16 alanine scans in DCAF16-knockout K562 cells. The x axis is a degradation screen for BRD4BD2-eGFP upon treatment with TMX1 at 1 μM for 16 h (n = 3), and the y axis is another degradation screen for BRD4BD2-eGFP upon treatment with KB02-JQ1 at 10 μM for 16 h (n = 3). b, Western blots of BRD4 degradation in DCAF16-knockout K562 cells that were transduced with indicated HA-DCAF16 mutants and treated with DMSO or TMX1 at 1 μM for 16 h. c, Flag IP followed by western blots in the presence of DMSO or TMX1 at 1 μM from 293T cells transfected with indicated HA-DCAF16 mutants and BRD4BD2-Flag constructs. d, TR-FRET signal for DDB1–DCAF16(WT) or DDB1–DCAF16(C58S)–BODIPY to BRD4BD2-terbium with increasing concentrations of TMX1 (n = 3). e, Intact protein mass spectra of DDB1–DCAF16(WT) or DDB1–DCAF16(C58S) co-incubated with TMX1 and BRD4BD2 at 4 °C for 16 h. All western blot data are representative of two independent measurements. KO, knockout; WT, wild-type. Source data
Fig. 5
Fig. 5. Residues crucial for BRD4BD2 conformation confer selectivity.
a, Correlation of fold change for two BRD4BD2 alanine mutagenesis screens. The x axis is a degradation screen for BRD4BD2-eGFP in K562 cells upon treatment with TMX1 at 1 μM for 16 h (n = 2), and the y axis is another degradation screen for BRD4BD2-eGFP in K562 cells upon treatment with dBET6 at 1 μM for 16 h (n = 2). b, Flow cytometry analysis of K562 cells expressing wild-type or indicated mutant BRD4BD2-eGFP construct and treated with DMSO, GNE11 at 1 μM, TMX1 at 1 μM, MMH1 at 0.1 μM, MMH2 at 0.1 μM, MZ1 at 1 μM or dBET6 at 1 μM for 16 h. Biologically independent replicates are shown (n = 3). c, Flow cytometry analysis of K562 cells expressing the indicated BRD4BD2-eGFP, BRD4BD1-eGFP mutant construct and treated with increasing concentrations of TMX1 for 16 h (n = 3). d, Flag IP followed by western blots in the presence of DMSO or TMX1 at 1 μM from 293T cells transfected with HA-DCAF16 and indicated BRD4BD2-Flag, BRD4BD1-Flag mutant constructs. All western blot data are representative of two independent measurements. WT, wild-type. Source data
Fig. 6
Fig. 6. Template-assisted covalent modification of GAK.
a, Flag IP followed by western blots in the presence of DMSO, JQ1, GNE11, TMX1, MMH1, MMH1-NR, MMH2 or MMH2-NR at 1 μM from 293T cells transfected with GAK14–351-HA and BRD4BD2-Flag constructs. b, Deconvoluted spectra for intact protein mass spectrometry experiments of GAK14–351 co-incubated with MMH2 at 4 °C for 16 h or GAK14–351 co-incubated with MMH2 and BRD4BD2 at 4 °C for 16 h. c, Flag IP followed by western blots in the presence of DMSO or TMX1 at 1 μM from 293T cells transfected with BRD4BD2-Flag and indicated cysteine mutant of GAK14–351-HA constructs. d, MS/MS spectrum of GAK peptide containing MMH2-modified cysteine (amino acids 81–90). All western blot data are representative of two independent measurements. WT, wild-type. Source data
Extended Data Fig. 1
Extended Data Fig. 1. Degradation characterization of JQ1-derived compounds.
a. The domain structure of BRD4. b. Schematic of BRD4BD stability reporter. IRES, internal ribosome entry site. c. Flow cytometry analysis of BRD4BD1-eGFP and BRD4BD2-eGFP degradation in K562 cells that were treated with increasing concentrations of GNE11 for 16 h (n = 3). d. Western blots of BRD4 degradation in K562 cells that were treated with JQ1, TMX1 or GNE11 at 1 μM for increasing time points. e. Flow cytometry analysis of BRD4BD1-eGFP and BRD4BD2-eGFP degradation in K562 cells that were treated with increasing concentrations of TMX1 for 16 h (n = 3). f. Quantitative whole proteome analysis of K562 cells after treatment with JQ1 at 0.5 μM (n = 1) or DMSO (n = 3) for 5 h. Statistical analysis was performed using a two-sided moderated t-test as implemented in the limma package. g. Western blots of BRD4 degradation in K562 cells that were treated with DMSO, TMX1 at 1 μM, GNE11 at 1 μM, MG132 at 10 μM, MLN7243 at 1 μM, and MLN4924 at 1 μM for 16 h. All western blot data are representative of two independent measurements. Source data
Extended Data Fig. 2
Extended Data Fig. 2. Covalent recruitment of DCAF16 is facilitated by BRD4BD2.
a. Flag immunoprecipitation (IP) followed by mass spectrometry in 293 T cells overexpressing BRD4BD2-Flag of cells treated with either MLN4924 plus GNE11 both at 1 μM (n = 4), or MLN4924 at 1 μM only (n = 4). Fold enrichment and p-values were calculated by comparing GNE11/MLN4924 treated samples to MLN4924 only control samples. Statistical analysis was performed using a two-sided moderated t-test as implemented in the limma package. b. Schematic of the TR-FRET set-up. Positions of FRET donor (terbium-coupled streptavidin) and acceptor (BODIPY–SpyCatcher) are indicated in the structural model. c. TR-FRET signal for DDB1-DCAF16-BODIPY to BRD4BD1-terbium or BRD4BD2-terbium with increasing concentrations of GNE11 (n = 3). d. Intact protein mass spectra of DDB1-DCAF16 co-incubated with GNE11 at 25 °C for 16 h, or DDB1-DCAF16 co-incubated with GNE11 and BRD4BD2 at 25 °C for 16 h. e. Intact protein mass spectra of DDB1-DCAF16 alone, DDB1-DCAF16 co-incubated with KB02-JQ1 at 4 °C for 16 h, or DDB1-DCAF16 co-incubated with KB02-JQ1 and BRD4BD2 at 4 °C for 16 h. Source data
Extended Data Fig. 3
Extended Data Fig. 3. Optimized electrophilic warheads increases potency of degraders.
a. Flow cytometry analysis of BRD4BD2-eGFP degradation in K562 cells that were treated with increasing concentrations of JQ1, GNE11, TMX1, MMH1 or MMH2 for 16 h (n = 3). b. Flow analysis of BRD4BD2-eGFP degradation in K562 cells that were treated with JQ1 at 1 μM, TMX1 at 1 μM, GNE11 at 1 μM, MMH1 at 0.1 μM or MMH2 at 0.1 μM for increasing time points (n = 3). c. Flow cytometry analysis of BRD4BD2-eGFP degradation in K562 cells that were treated with increasing concentrations of MMH1 or MMH2 for 16 h (n = 3). d. TR-FRET signal for DDB1-DCAF16-BODIPY to BRD4BD2-terbium with increasing concentrations of JQ1, GNE11, TMX1, MMH1 or MMH2 (n = 3). e. Flow cytometry analysis of BRD4BD2-eGFP degradation in K562 cells that were treated with increasing concentrations of MMH1, MMH2, dBET6 or MZ1 for 2 h, 6 h, or 16 h (n = 3). f. Western blot of BRD4 degradation in K562 cells pre-treated with MMH1, MMH2, dBET6 or MZ1 at 0.1 μM for 4 h, washed with PBS and resuspended in fresh media or the same drug-treated media for an additional 20 h. g. Western blots of BRD4 degradation in K562 cells that were treated with DMSO, MMH2 or dBET6 at 0.1 μM for 24, 48, or 72 h. All western blot data are representative of two independent measurements. Source data
Extended Data Fig. 4
Extended Data Fig. 4. MMH1 and MMH2 conserve the mechanism of action as TMX1 and GNE11.
a. Flow cytometry analysis of BRD4BD1-eGFP and BRD4BD2-eGFP degradation in K562 cells that were treated with increasing concentrations of MMH1 for 16 h (n = 3). b. Flow cytometry analysis of BRD4BD1-eGFP and BRD4BD2-eGFP degradation in K562 cells that were treated with increasing concentrations of MMH2 for 16 h (n = 3). c. Quantitative whole proteome analysis of K562 cells after treatment with MMH1 at 0.1 μM (n = 2) or DMSO (n = 4) for 5 h. Statistical analysis was performed using a two-sided moderated t-test as implemented in the limma package. d. Quantitative whole proteome analysis of K562 cells after treatment with MMH2 at 0.1 μM (n = 2) or DMSO (n = 4) for 5 h. Statistical analysis was performed using a two-sided moderated t-test as implemented in the limma package. e. Intact protein mass spectra of DDB1-DCAF16 co-incubated with MMH1 at 4 °C for 16 h, or DDB1-DCAF16 co-incubated with MMH1 and BRD4BD2 at 4 °C for 16 h. f. Intact protein mass spectra of DDB1-DCAF16 co-incubated with MMH2 at 4 °C for 16 h, or DDB1-DCAF16 co-incubated with MMH2 and BRD4BD2 at 4 °C for 16 h. Source data
Extended Data Fig. 5
Extended Data Fig. 5. MMH2-Biotin characterization suggests limited off-target activity of covalent degraders.
a. Chemical structure of MMH2-Biotin. b. Biotin pull-down followed by mass spectrometry in K562 cell lysates treated with either MMH2-Biotin at 1 μM (n = 3), or DMSO at 1 μM only (n = 3). Fold enrichment and p-values were calculated by comparing MMH2-Biotin treated samples to DMSO control samples. Statistical analysis was performed using a two-sided moderated t-test as implemented in the limma package. c. Flow cytometry analysis of BRD4BD2-eGFP degradation in K562 cells that were treated with increasing concentrations of MMH2 or MMH2-Biotin for 16 h (n = 3). d. TR-FRET signal for DDB1-DCAF16-BODIPY to BRD4BD2-terbium with increasing concentrations of MMH2 or MMH2-Biotin (n = 3). Source data
Extended Data Fig. 6
Extended Data Fig. 6. Map quality of the DCAF16-BRD4BD2-MMH2 interface.
a. Cryo-EM density for DCAF16 containing Cys58 covalently bound to MMH2. Map contoured at 0.251. b. Cryo-EM density for DCAF16. c. Cryo-EM density for BRD4BD2. d. Overlay of MMH2 with JQ1 (PDB: 3ONI, in white). e. Key residues on DCAF16 (in green and blue) and BRD4BD2 (in magenta) close to MMH2.
Extended Data Fig. 7
Extended Data Fig. 7. Validation of DCAF16 mutants.
a. Flow cytometry analysis of BRD4BD2-eGFP degradation in DCAF16 knockout K562 cells transduced with indicated HA-DCAF16 mutants and treated with increasing concentrations of KB02-JQ1 for 16 h (n = 3). b. Flow cytometry analysis of eGFP-SPIN4 stability in DCAF16 knockout K562 cells transduced with indicated HA-DCAF16 mutants (n = 3). c. Western blots of Flag immunoprecipitation (IP) from 293 T cells transfected with indicated HA-DCAF16 mutants and Flag-SPIN4 constructs. d. Close up of DCAF16 Ala53 orienting towards the hydrophobic core. e. Close up of DCAF16 Cys177 and Cys179 coordinating a structural zinc ion. f. Intact protein mass spectra of DDB1-DCAF16(WT) co-incubated with MMH2, DDB1-DCAF16(WT) co-incubated with MMH2 and BRD4BD2, DDB1-DCAF16(C58S) co-incubated with MMH2, or DDB1-DCAF16(C58S) co-incubated with MMH2 and BRD4BD2 at 4 °C for 16 h. All western blot data are representative of two independent measurements. Source data
Extended Data Fig. 8
Extended Data Fig. 8. Characterization of IBG1.
a. Intact protein mass spectra of DDB1-DCAF16 co-incubated with IBG1 at 4 °C for 16 hours or DDB1-DCAF16 co-incubated with IBG1 and BRD4tandem at 4 °C for 16 hours. b. Western blots of BRD4 degradation in DCAF16 knockout K562 cells that were transduced with indicated HA-DCAF16 mutants, and treated with DMSO or IBG1 at 1 μM for 16 h. c. Flow cytometry analysis of BRD4tandem-eGFP degradation in DCAF16 knockout K562 cells transduced with indicated HA-DCAF16 mutants and treated with increasing concentrations of IBG1 for 16 h (n = 3). All western blot data are representative of two independent measurements. Source data
Extended Data Fig. 9
Extended Data Fig. 9. Mechanism of bromodomain selectivity.
a. Correlation of fold change for two BRD4BD2 alanine mutagenesis screens. The x axis is a degradation screen for BRD4BD2-eGFP in K562 cells upon treatment with TMX1 at 1 μM for 16 h (n = 2), and the y axis is another degradation screen for BRD4BD2-eGFP in K562 cells upon treatment with MZ1 at 1 μM for 16 h (n = 2). b. Overlay of BRD4BD1 (PDB: 3MXF, in yellow) with BRD4BD2 (in magenta) showing a close-up of residues His437. When substituted for Asp144 in BRD4BD1, there is repulsion between Asp144 and the JQ1 carbonyl. c. Overlay of BRD2BD2 (PDB: 3ONI, in cyan) with BRD4BD2 (in magenta) showing a close-up of residues His437 and the corresponding His433 in BRD2BD2. d. AlphaScreen competitive assay of JQ1, GNE11, and TMX1 to quantify the drug’s inhibition of binding between biotinylated-JQ1 and His-tagged BRD4BD1 or BRD4BD2 (n = 4). Source data
Extended Data Fig. 10
Extended Data Fig. 10. Template-assisted covalent modification of GAK.
a. Flag immunoprecipitation (IP) followed by Western blots in the presence of DMSO, JQ1, GNE11, TMX1 or MMH1 at 1 μM from 293 T cells transfected with ERP29-HA and BRD4BD2-Flag constructs. b. Deconvoluted spectra for intact protein mass spectrometry experiments of GAK14-351 co-incubated with TMX1 at 4 °C for 16 hours or GAK14-351 co-incubated with TMX1 and BRD4BD2 at 4 °C for 16 hours. All western blot data are representative of two independent measurements. Source data

Update of

References

    1. Fink, E. C. & Ebert, B. L. The novel mechanism of lenalidomide activity. Blood126, 2366–2369 (2015). - PMC - PubMed
    1. Fuchs, O. Treatment of lymphoid and myeloid malignancies by immunomodulatory drugs. Cardiovasc. Hematol. Disord. Drug Targets19, 51–78 (2019). - PubMed
    1. Li, F., Aljahdali, I. A. M. & Ling, X. Molecular glues: capable protein-binding small molecules that can change protein–protein interactions and interactomes for the potential treatment of human cancer and neurodegenerative diseases. Int. J. Mol. Sci.23, 6206 (2022). - PMC - PubMed
    1. Salami, J. & Crews, C. M. Waste disposal—an attractive strategy for cancer therapy. Science355, 1163–1167 (2017). - PubMed
    1. Lai, A. C. & Crews, C. M. Induced protein degradation: an emerging drug discovery paradigm. Nat. Rev. Drug Discov.16, 101–114 (2017). - PMC - PubMed

Publication types

Grants and funding