. 2024 Jul 29;15(1):227.
doi: 10.1186/s13287-024-03843-9.

Insulin promotes the bone formation capability of human dental pulp stem cells through attenuating the IIS/PI3K/AKT/mTOR pathway axis

Affiliations

Insulin promotes the bone formation capability of human dental pulp stem cells through attenuating the IIS/PI3K/AKT/mTOR pathway axis

Lingling E et al. Stem Cell Res Ther. .

Abstract

Background: Insulin has been known to regulate bone metabolism, yet its specific molecular mechanisms during the proliferation and osteogenic differentiation of dental pulp stem cells (DPSCs) remain poorly understood. This study aimed to explore the effects of insulin on the bone formation capability of human DPSCs and to elucidate the underlying mechanisms.

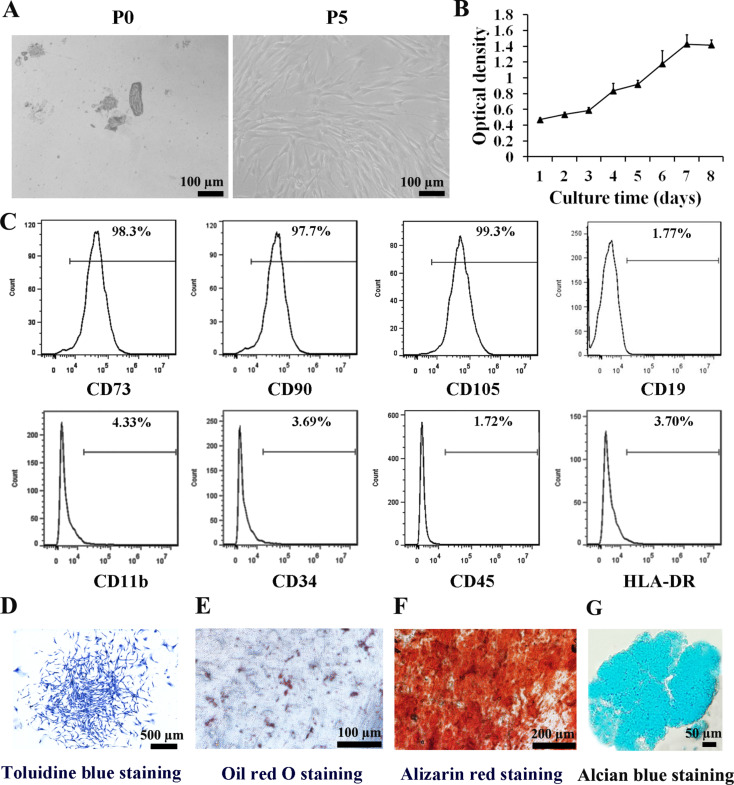
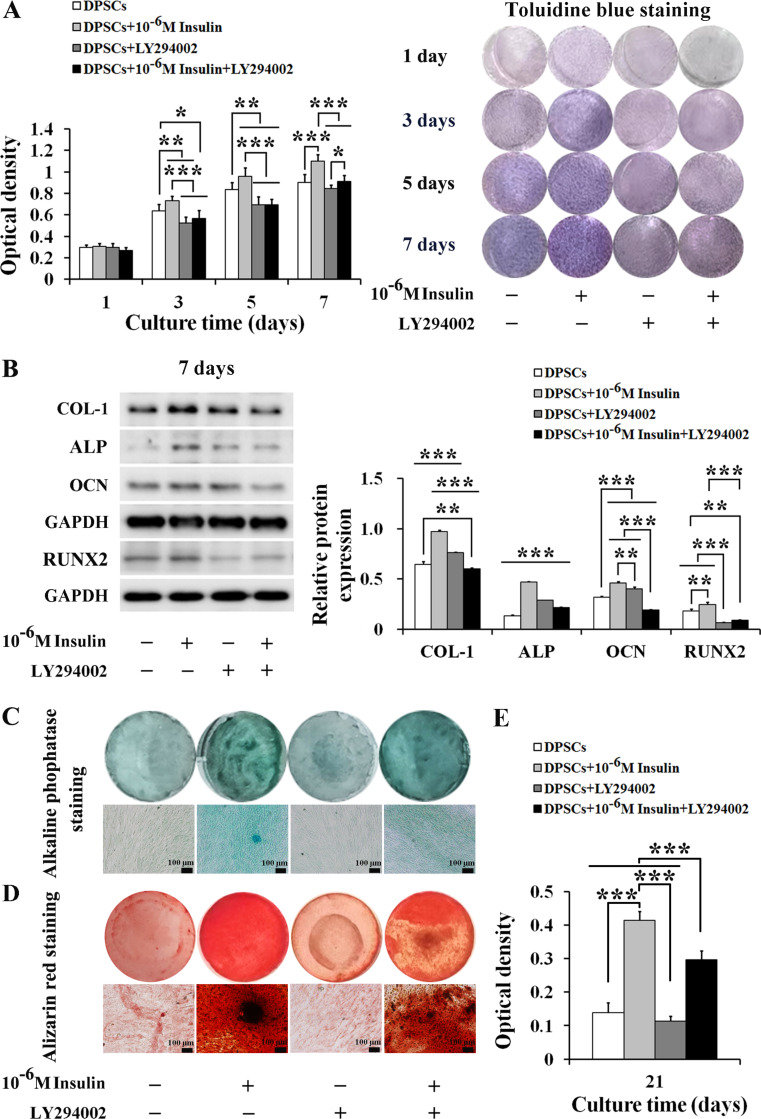
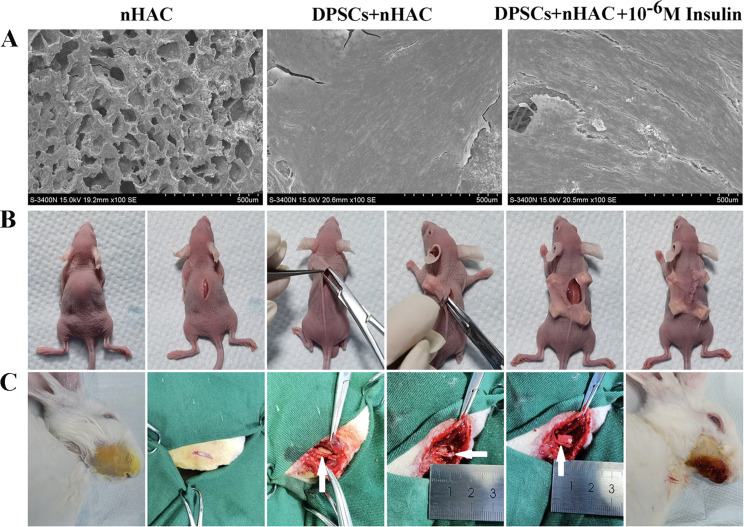
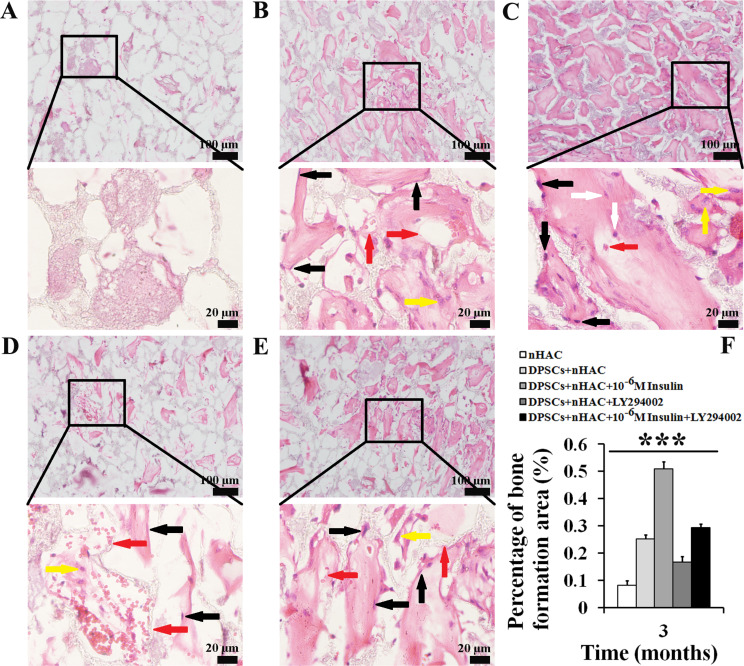
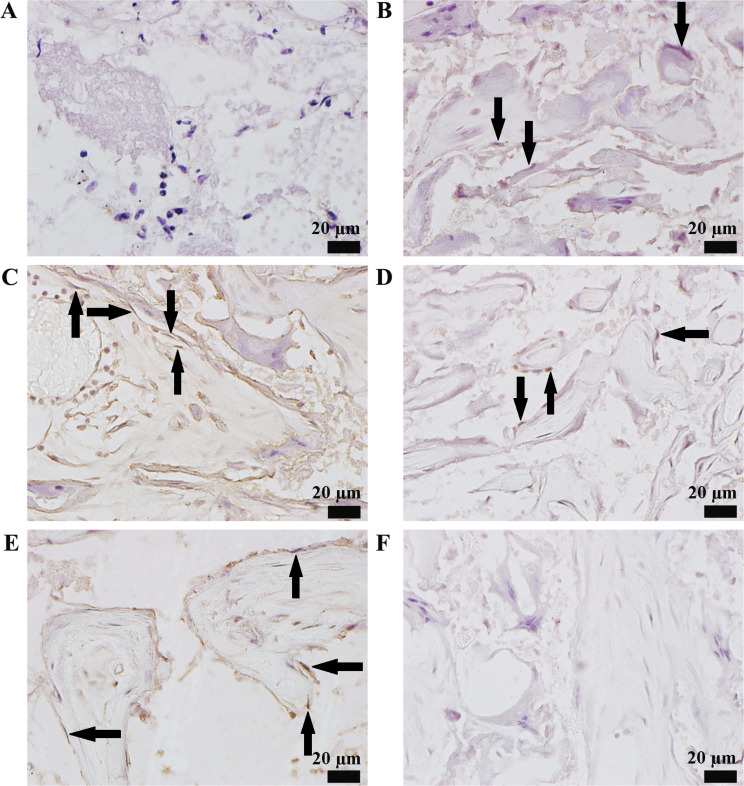
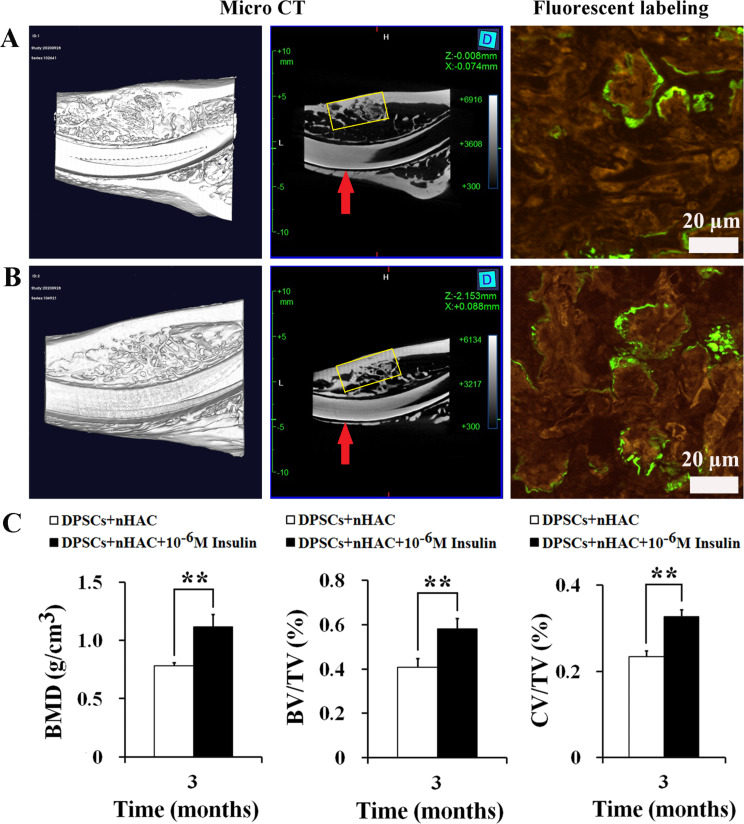
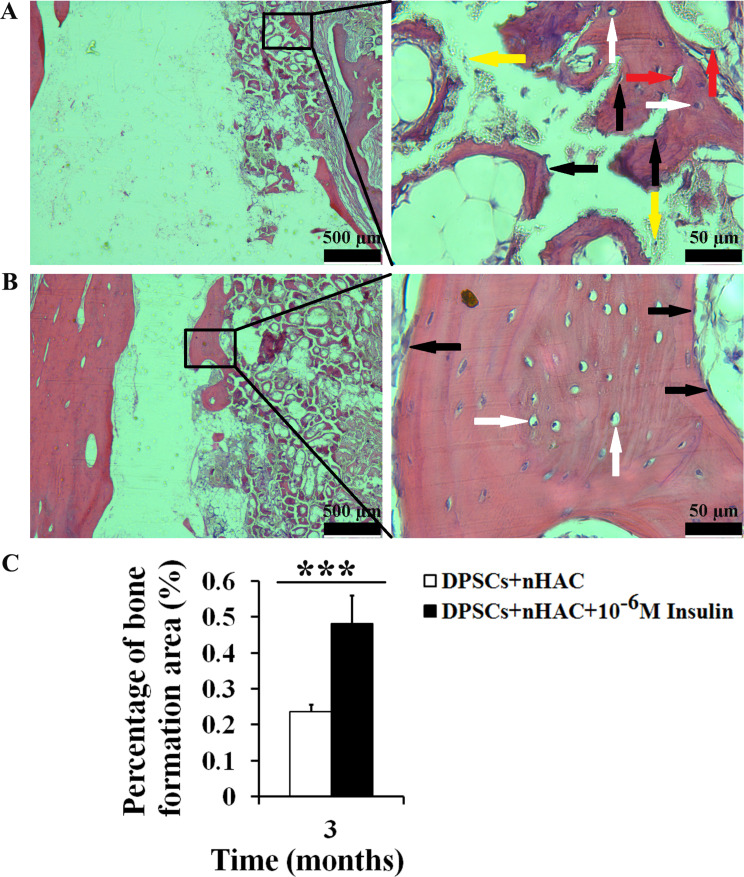
Methods: Cell proliferation was assessed using a CCK-8 assay. Cell phenotype was analyzed by flow cytometry. Colony-forming unit-fibroblast ability and multilineage differentiation potential were evaluated using Toluidine blue, Oil red O, Alizarin red, and Alcian blue staining. Gene and protein expressions were quantified by real-time quantitative polymerase chain reaction and Western blotting, respectively. Bone metabolism and biochemical markers were analyzed using electrochemical luminescence and chemical colorimetry. Cell adhesion and growth on nano-hydroxyapatite/collagen (nHAC) were observed with a scanning electron microscope. Bone regeneration was assessed using micro-CT, fluorescent labeling, immunohistochemical and hematoxylin and eosin staining.

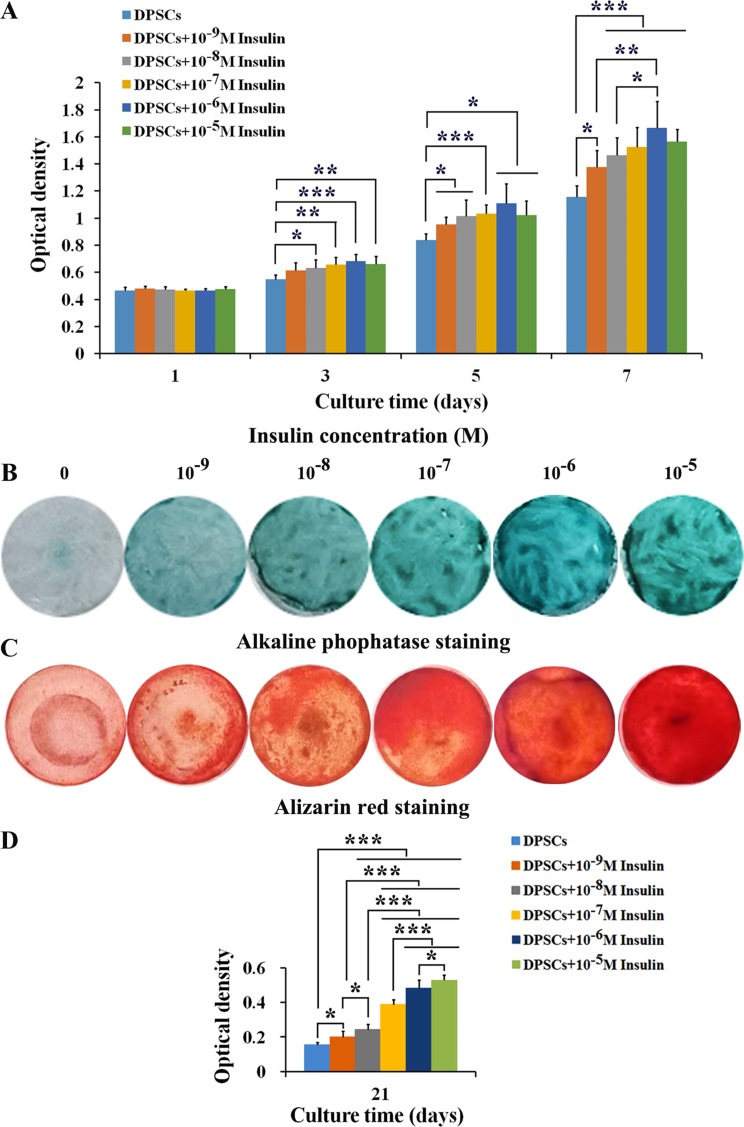
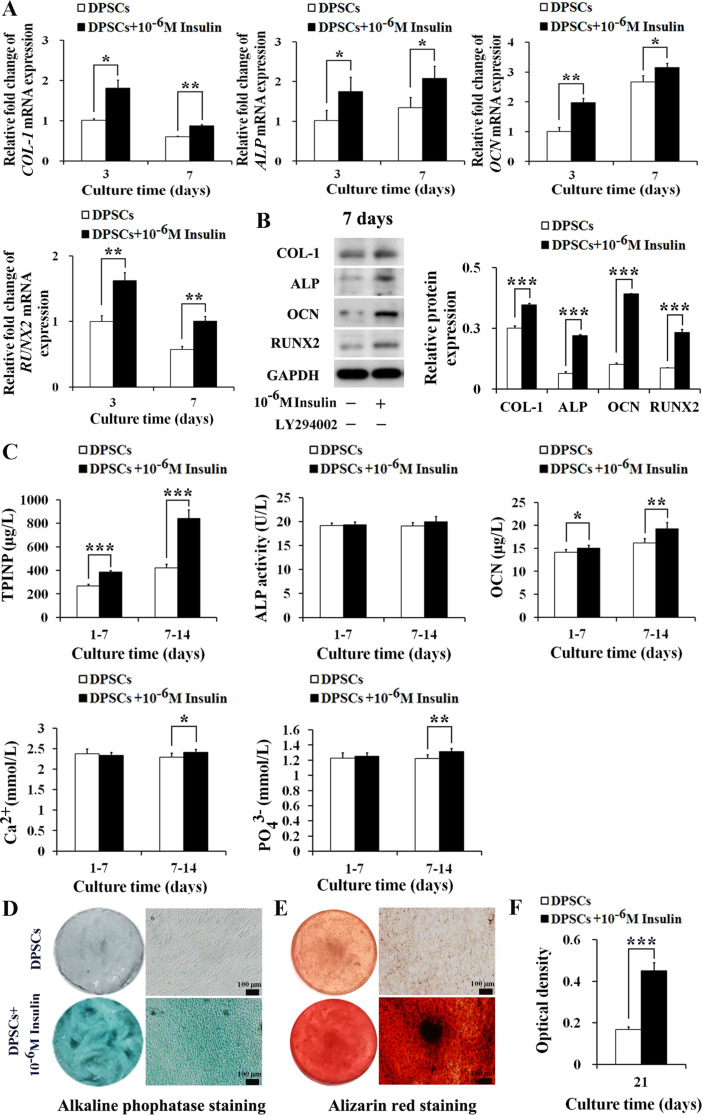
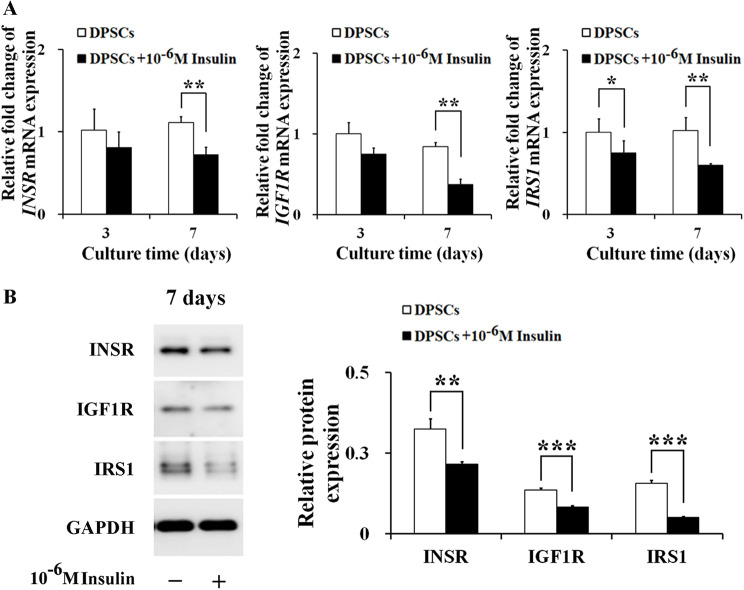
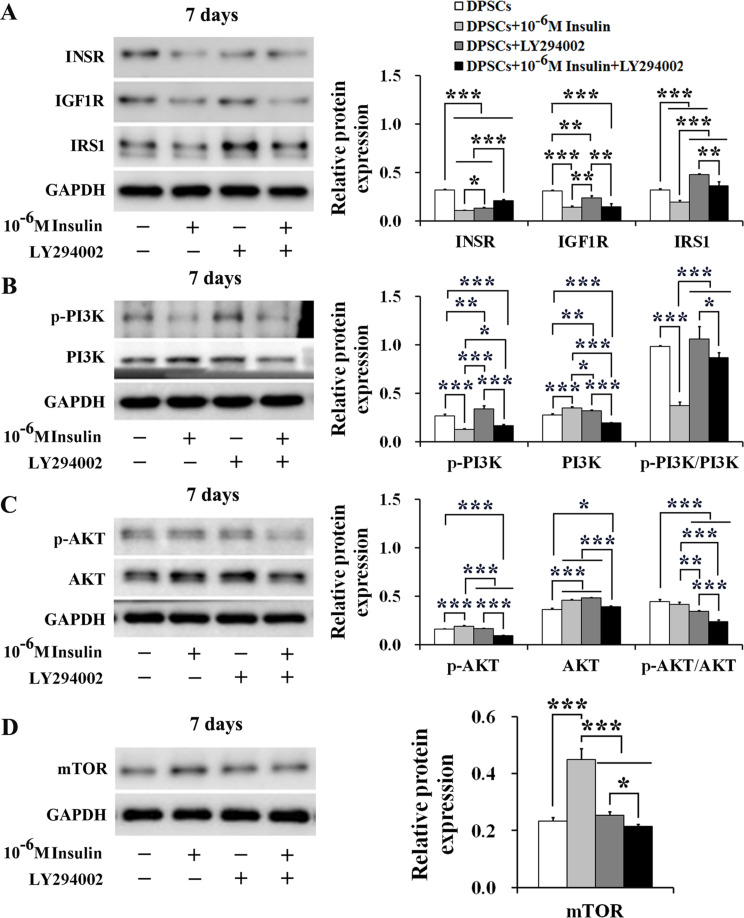
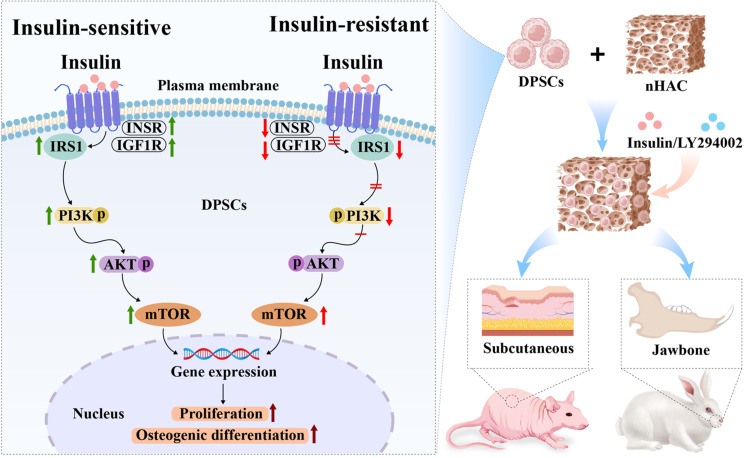
Results: Insulin enhanced the proliferation of human DPSCs as well as promoted mineralized matrix formation in a concentration-dependent manner. 10- 6 M insulin significantly up-regulated osteogenic differentiation-related genes and proteins markedly increased the secretion of bone metabolism and biochemical markers, and obviously stimulated mineralized matrix formation. However, it also significantly inhibited the expression of genes and proteins of receptors and receptor substrates associated with insulin/insulin-like growth factor-1 signaling (IIS) pathway, obviously reduced the expression of the phosphorylated PI3K and the ratios of the phosphorylated PI3K/total PI3K, and notably increased the expression of the total PI3K, phosphorylated AKT, total AKT and mTOR. The inhibitor LY294002 attenuated the responsiveness of 10- 6 M insulin to IIS/PI3K/AKT/mTOR pathway axis, suppressing the promoting effect of insulin on cell proliferation, osteogenic differentiation and bone formation. Implantation of 10- 6 M insulin treated DPSCs into the backs of severe combined immunodeficient mice and the rabbit jawbone defects resulted in enhanced bone formation.

Conclusions: Insulin induces insulin resistance in human DPSCs and effectively promotes their proliferation, osteogenic differentiation and bone formation capability through gradually inducing the down-regulation of IIS/PI3K/AKT/mTOR pathway axis under insulin resistant states.

Keywords: Bone regeneration; Human dental pulp stem cells; Insulin; Insulin/insulin-like growth factor-1 signaling (IIS) pathway; PI3K/AKT/mTOR pathway.


Conflict of interest statement

The authors declare that there are no conflicts of interest.

Figures

Fig. 1
Fig. 1
Isolation, culture, and characterization of human DPSCs. A P0 and P5 DPSCs were observed by an optical microscope at day 7 and day 2 (scale bars: 100 μm). B Growth curve of DPSCs was assessed using a CCK-8 assay. Data are expressed as mean ± SD of n = 8. C Phenotype of DPSCs was analyzed using flow cytometry. D CFU-F ability of DPSCs was evaluated using Toluidine blue staining at day 10 (scale bars: 500 μm). E Adipogenic differentiation of DPSCs was evaluated using Oil red O staining at day 21 (scale bars: 100 μm). F Mineralized matrix formation of DPSCs was evaluated using Alizarin red staining at day 21 (scale bars: 200 μm). G Chondrogenic differentiation of DPSCs was evaluated using Alcian blue staining at day 21 (scale bars: 50 μm)
Fig. 2
Fig. 2
Insulin promotes the proliferation and osteogenic differentiation of human DPSCs. A Insulin promoted the proliferation of DPSCs in a concentration-dependent manner (n = 8). B 10− 9∼10− 5 M insulin enhanced alkaline phosphatase staining of DPSCs at day 21. C 10− 9∼10− 5 M insulin enhanced Alizarin red staining of DPSCs at day 21. D Insulin promoted the mineralized matrix formation of DPSCs in a concentration-dependent manner at day 21 (n = 6). Data are expressed as the mean ± SD. *P < 0.05, **P < 0.01, ***P < 0.001
Fig. 3
Fig. 3
10− 6 M insulin promotes the osteogenic differentiation of human DPSCs. A 10− 6 M insulin up-regulated the mRNA levels of COL-1, ALP, OCN, and RUNX2 in DPSCs at day 3 and day 7 (n = 3). B 10− 6 M insulin promoted the protein expressions of COL-1, ALP, OCN, and RUNX2 in DPSCs at day 7 (n = 3). Representative western blotting (left) and quantification analysis (right). Full-length blots/gels are presented in Supplementary Fig. 1. C 10− 6 M insulin increased the secretion of extracellular bone metabolism and biochemical markers in DPSCs at day 1–7 and day 7–14 (n = 6). D 10− 6 M insulin enhanced alkaline phosphatase staining of DPSCs at day 21 (scale bars: 100 μm). E 10− 6 M insulin enhanced Alizarin red staining of DPSCs at day 21 (scale bars: 100 μm). F 10− 6 M insulin promoted the mineralized matrix formation of DPSCs at day 21 (n = 6). Data are expressed as the mean ± SD. *P < 0.05, **P < 0.01, ***P < 0.001
Fig. 4
Fig. 4
10− 6 M insulin inhibits the gene and protein expressions of the IIS-related receptors and substrates in human DPSCs. A 10− 6 M insulin down-regulated the mRNA levels of INSR, IGF1R, and IRS1 in DPSCs at day 3 and day 7. B 10− 6 M insulin inhibited the protein expressions of INSR, IGF1R, and IRS1 in DPSCs at day 7. Representative western blotting (left) and quantification analysis (right). Full-length blots/gels are presented in Supplementary Fig. 2. Data are expressed as the mean ± SD of n = 3. *P < 0.05, **P < 0.01, ***P < 0.001
Fig. 5
Fig. 5
LY294002 attenuates the responsiveness of 10− 6 M insulin to the IIS/PI3K/AKT/mTOR pathway axis in human DPSCs. A LY294002 attenuated the inhibiting effect of 10− 6 M insulin on the protein expressions of INSR, IGF1R, and IRS1 in DPSCs at day 7. B and C LY294002 attenuated the responsiveness of 10− 6 M insulin to the PI3K/AKT pathway in DPSCs at day 7. D LY294002 attenuated the promoting effect of 10− 6 M insulin on the protein expression of mTOR in DPSCs at day 7. Representative western blotting (left) and quantification analysis (right). Data are expressed as the mean ± SD of n = 3. Full-length blots/gels are presented in Supplementary Figs. 3–6. *P < 0.05, **P < 0.01, ***P < 0.001
Fig. 6
Fig. 6
LY294002 attenuates the promoting effect of 10− 6 M insulin on the proliferation and osteogenic differentiation of human DPSCs. A LY294002 attenuated the promoting effect of 10− 6 M insulin on the proliferation of DPSCs at day 1, 3, 5, and 7. (n = 8). B LY294002 attenuated the promoting effect of 10− 6 M insulin on the protein expression of COL-1, ALP, OCN and RUNX2 in DPSCs at day 7 (n = 3). Representative western blotting (left) and quantification analysis (right). Full-length blots/gels are presented in Supplementary Fig. 7. C LY294002 attenuated the enhancing effect of 10− 6 M insulin on alkaline phosphatase staining of DPSCs at day 21 (scale bars: 100 μm). D LY294002 attenuated the enhancing effect of 10− 6 M insulin on Alizarin red staining of DPSCs at day 21 (scale bars: 100 μm). E LY294002 attenuated the promoting effect of 10− 6 M insulin on the mineralized matrix formation of DPSCs at day 21. Data are expressed as the mean ± SD of n = 6. *P < 0.05, **P < 0.01, ***P < 0.001
Fig. 7
Fig. 7
Scanning electron microscope observation and the schematic diagram of the surgery. A Scanning electron microscope observation of the constructs at day 7 (scale bars: 500 μm). B The constructs were subcutaneously implanted into the backs of SCID mice. C The constructs were implanted into the jawbone defects in New Zealand white rabbits. The white arrow indicates the mental nerve
Fig. 8
Fig. 8
Hematoxylin and eosin staining after the constructs were implanted subcutaneously into the backs of SCID mice for 3 months. A nHAC group. B DPSCs + nHAC group. C DPSCs + nHAC + 10− 6 M Insulin group. D DPSCs + nHAC + LY294002 group. E DPSCs + nHAC + 10− 6 M Insulin + LY294002 group. The image below (scale bars: 20 μm) is respectively a magnification of the image above in Figure A-E (scale bars: 100 μm). F Percentage of bone formation area. The black arrow indicates osteoblasts, the white arrow indicates osteocytes in bone lacuna, the yellow arrow indicates osteoclasts, the red arrow indicates blood vessels. Data are expressed as the mean ± SD of n = 6. ***P < 0.001
Fig. 9
Fig. 9
Immunohistochemical staining of OCN after the constructs were implanted subcutaneously into the backs of SCID mice for 3 months. A nHAC group. B DPSCs + nHAC group. C DPSCs + nHAC + 10− 6 M Insulin group. D DPSCs + nHAC + LY294002 group. E DPSCs + nHAC + 10− 6 M Insulin + LY294002 group. F PBS replaced the primary antibody. Scale bars: 20 μm. The black arrow indicates osteoblasts
Fig. 10
Fig. 10
Micro-CT and confocal laser scanning microscopy observation after the constructs were implanted into the jawbone defects in rabbits for 3 months. A DPSCs + nHAC group. B DPSCs + nHAC + 10− 6 M Insulin group. Calcein fluorescence was displayed in green under confocal laser scanning microscopy (scale bars: 20 μm). C Bone mineral density (BMD), bone volume/total volume (BV/TV), and cortical bone volume/total volume (CV/TV) were evaluated by micro-CT measurements. Data are expressed as the mean ± SD of n = 3. The red arrow indicates the incisors of the mandible. The yellow box indicates the jawbone defects. **P < 0.01
Fig. 11
Fig. 11
Hematoxylin and eosin staining after the constructs were implanted into the jawbone defects in rabbits for 3 months. A DPSCs + nHAC group. B DPSCs + nHAC + 10− 6 M Insulin group. The image on the right (scale bars: 50 μm) is a magnification of the image on the left (scale bars: 500 μm). C Percentage of bone formation area. Data are expressed as the mean ± SD of n = 6. The black arrow indicates osteoblasts, the white arrow indicates osteocytes in bone lacuna, the yellow arrow indicates osteoclasts, the red arrow indicates blood vessels. ***P < 0.001
Fig. 12
Fig. 12
Schematic diagram of the mechanism by which 10− 6 M insulin impacts the bone formation capability of human DPSCs

Similar articles

Cited by

References

    1. Wu YY, Xiao E, Graves DT. Diabetes mellitus related bone metabolism and periodontal disease. Int J Oral Sci. 2015;7:63–72. 10.1038/ijos.2015.2 - DOI - PMC - PubMed
    1. Saito N, Mikami R, Mizutani K, Takeda K, Kominato H, Kido D, Ikeda Y, Buranasin P, Nakagawa K, Takemura S, et al. Impaired dental implant osseointegration in rat with streptozotocin-induced diabetes. J Periodontal Res. 2022;57:412–24. 10.1111/jre.12972 - DOI - PubMed
    1. Ahn JJ, Shin HI. Bone tissue formation in extraction sockets from sites with advanced periodontal disease: a histomorphometric study in humans. Int J Oral Maxillofac Implants. 2008;23:1133–8. - PubMed
    1. Li Q, Wang H, Liu L, Weng Y, Xu S, Li L, Wang Z. Suppression of the NLRP3 inflammasome through activation of the transient receptor potential channel melastatin 2 promotes osteogenesis in tooth extraction sockets of periodontitis. Am J Pathol. 2023;193:213–32. 10.1016/j.ajpath.2022.10.009 - DOI - PubMed
    1. Shen X, Shen X, Li B, Zhu W, Fu Y, Xu R, Du Y, Cheng J, Jiang H. Abnormal macrophage polarization impedes the healing of diabetes-associated tooth sockets. Bone. 2021;143:115618. 10.1016/j.bone.2020.115618 - DOI - PubMed

Publication types

MeSH terms

LinkOut - more resources