. 2025 May 1;20(5):1455-1466.
doi: 10.4103/NRR.NRR-D-23-00794. Epub 2024 Jan 31.

Endoplasmic reticulum stress and autophagy in cerebral ischemia/reperfusion injury: PERK as a potential target for intervention

Affiliations

Endoplasmic reticulum stress and autophagy in cerebral ischemia/reperfusion injury: PERK as a potential target for intervention

Ju Zheng et al. Neural Regen Res. .

Abstract

JOURNAL/nrgr/04.03/01300535-202505000-00028/figure1/v/2024-07-28T173839Z/r/image-tiff Several studies have shown that activation of unfolded protein response and endoplasmic reticulum (ER) stress plays a crucial role in severe cerebral ischemia/reperfusion injury. Autophagy occurs within hours after cerebral ischemia, but the relationship between ER stress and autophagy remains unclear. In this study, we established experimental models using oxygen-glucose deprivation/reoxygenation in PC12 cells and primary neurons to simulate cerebral ischemia/reperfusion injury. We found that prolongation of oxygen-glucose deprivation activated the ER stress pathway protein kinase-like endoplasmic reticulum kinase (PERK)/eukaryotic translation initiation factor 2 subunit alpha (eIF2α)-activating transcription factor 4 (ATF4)-C/EBP homologous protein (CHOP), increased neuronal apoptosis, and induced autophagy. Furthermore, inhibition of ER stress using inhibitors or by siRNA knockdown of the PERK gene significantly attenuated excessive autophagy and neuronal apoptosis, indicating an interaction between autophagy and ER stress and suggesting PERK as an essential target for regulating autophagy. Blocking autophagy with chloroquine exacerbated ER stress-induced apoptosis, indicating that normal levels of autophagy play a protective role in neuronal injury following cerebral ischemia/reperfusion injury. Findings from this study indicate that cerebral ischemia/reperfusion injury can trigger neuronal ER stress and promote autophagy, and suggest that PERK is a possible target for inhibiting excessive autophagy in cerebral ischemia/reperfusion injury.


Conflict of interest statement

Conflicts of interest: The authors declared no conflict of interest.

Figures

Figure 1
Figure 1
ER stress, autophagy, and apoptosis in the PC12 cell model of ischemia/reperfusion. (A–F) Protein levels of ER stress markers GRP78 (A), PERK (B), p-PERK (C), Beclin1 (D), LC3II/LC3I (E), and antiapoptotic protein Bcl-2 (F) were measured using western blot analysis. (G, H) Immunofluorescence assay of GRP78 (Alexa-FluorTM 488, green) (G) and LC3 (Alexa-Fluor™ 568, red) (H) proteins in the 9-hour/24-hour group (original magnification 400×, scale bar: 20 µm). Compared with the control group, the 9-hour/24-hour group had a notable increase in both green (I) and red (J) fluorescence intensities. Data are expressed as mean ± SD. All experiments were repeated three times. *P < 0.05, **P < 0.01, vs. control group; #P < 0.05 (one-way analysis of variance followed by the least significant difference post hoc test). Bcl2: B-cell lymphoma-2; DAPI: 4,6-diamidino-2-phenylindole; ER: endoplasmic reticulum; GRP78: glucose-regulated protein 78; LC3: microtubule-associated protein 1 light chain 3; p-PERK: phosphorylation of PERK; PERK: protein kinase RNA-like endoplasmic reticulum kinase.
Figure 2
Figure 2
ER stress-induced autophagy through PERK/eIF2α-ATF4-CHOP signaling pathway. (A–C) PERK siRNA transfection in PC12 cells. Red served as a negative control and incorporated a Cy5 fluorescent label (original magnification 200×, scale bar: 50 µm). (D) PERK gene interference efficiency using western blot assay. The levels of PERK (E), GRP78 (F), eIF2α/p-eIF2α (G), ATF-4 (H), CHOP (I), Beclin1 (J), and LC3II /LC3I (K) were normalized to β-actin. Data are expressed as mean ± SD. All experiments were repeated three times. *P < 0.05, **P < 0.01, vs. control group; #P < 0.05 (one-way analysis of variance followed by the least significant difference post hoc test). ATF4: Activating transcription factor 4; CHOP: C/EBP homologous protein; eIF2α: eukaryotic translation initiation factor 2 subunit alpha; ER: endoplasmic reticulum; GRP78: glucose-regulated protein 78; LC3: microtubule-associated protein 1 light chain 3; p-eIF2α: phosphorylation of eIF2α; PERK: protein kinase RNA-like endoplasmic reticulum kinase; siRNA: small interfering RNA.
Figure 3
Figure 3
ER stress and autophagy-related protein expression changes in PC12 cells after OGD/R treatment. (A–H) Levels of ER stress proteins GRP78 (A), p-eIF2α/eIF2α (B), ATF-4 (C), Beclin1 (D), autophagy-associated proteins LC3II/LC3I (E), p62 (F), antiapoptotic protein Bcl-2 (G), and proapoptotic protein Bax (H) were detected by western blot assay. Data are expressed as mean ± SD. All experiments were repeated three times. *P < 0.05, **P < 0.01, vs. control group; #P < 0.05, ##P < 0.01 (one-way analysis of variance followed by the least significant difference post hoc test). Bax: BCL-2-associated X protein; Bcl2: B-cell lymphoma-2; CQ: chloroquine; ER: endoplasmic reticulum; GRP78: glucose-regulated protein 78; LC3: microtubule-associated protein 1 light chain 3; p-eIF2α: phosphorylation of eIF2α; PERK: protein kinase RNA-like endoplasmic reticulum kinase.
Figure 4
Figure 4
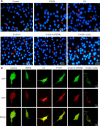
Autophagy flux in the ischemia/reperfusion PC12 cell model. (A) Apoptosis was verified in different groups using Hoechst 33342 staining (original magnification 400×, scale bar: 100 µm). The red arrows point to apoptotic cell nuclei. The 9-hour/24-hour and 9-hour/24-hour (CQ) groups exhibited stronger, dense blue fluorescence than the other groups. Apoptotic cells are stained bright blue and show shrunken nuclei (red arrows). (B) The PC12 cells were transfected with mRFP-GFP-LC3 adenovirus (original magnification 1000×, scale bar: 10 µm). The yellow spots represent autophagosomes and red spots represent autolysosomes. Compared with the control group, 9-hour/24-hour treatment induced autophagy in PC12 cells. In the 9-hour/24-hour (CQ) group, the number of yellow spots was higher than that of the CQ group. Both the 9-hour/24-hour and 9-hour/24-hour (iPERK) groups exhibited yellow spot formation; however, the quantity and intensity of yellow spots were lower in the 9-hour/24-hour (iPERK) group compared with the 9-hour/24-hour group. CQ: Chloroquine; GFP: green fluorescent protein; LC3: microtubule-associated protein 1 light chain 3; PERK: protein kinase RNA-like endoplasmic reticulum kinase; RFP: red fluorescent protein.
Figure 5
Figure 5
Flow cytometry and transmission electron microscopy in the ischemia/reperfusion PC12 cell model. (A–G) Apoptosis flow chart and cell apoptosis rate. Compared with that in the control group, the apoptosis rate increased in the 9-hour/24-hour group and 9-hour/24-hour (CQ) group, and it decreased in the 9-hour/24-hour (iPERK) group compared with the 9-hour/24-hour group. Data are expressed as mean ± SD. All experiments were repeated three times. **P < 0.01, vs. control group; ##P < 0.01 (one-way analysis of variance followed by the least significant difference post hoc test). (H–M) Transmission electron microscopy images (arrows point to autophagosomes). No autophagosomes were observed in the control (H) and iPERK groups (I), and few autophagosomes were observed in the CQ group (J). Compared with that in the 9-hour/24-hour group (K), fewer autophagosomes were observed in the 9-hour/24-hour (iPERK) group (L, red arrow) and more were observed in the 9-hour/24-hour (CQ) group (M, red arrows). CQ: Chloroquine; GFP: green fluorescent protein; PERK: protein kinase RNA-like endoplasmic reticulum kinase; RFP: red fluorescent protein.
Figure 6
Figure 6
ER stress and autophagy-related protein expression changes in primary hippocampal neurons after OGD/R treatment. (A) The visualization of astrocytic marker GFAP (Alexa-FluorTM 488, green) and primary hippocampal neuronal marker NeuN (Cyanine3, red) (original magnification 400×, scale bars: 100 µm). (B) The purity of primary hippocampal neurons was 83%. (C–I) Levels of ER stress proteins GRP78 (C) and p-eIF2α/eIF2α (D), and autophagy-related proteins LC3II/LC3I (E) and Beclin 1 (F) were increased in primary hippocampal cells after 2 hours/24 hours. Levels of p62 (G) and Bcl-2 (H) were decreased (G), and that of Bax (I) was increased. Data are expressed as mean ± SD. All experiments were repeated three times. *P < 0.05, **P < 0.01, vs. control group; #P < 0.05, ##P < 0.01 (one-way analysis of variance followed by the least significant difference post hoc test). Bax: Bcl-2-associated X protein; Bcl2: B-cell lymphoma-2; CQ: Chloroquine; eIF2α: eukaryotic translation initiation factor 2 subunit alpha; ER: endoplasmic reticulum; GFAP: glial fibrillary acidic protein; GRP78: glucose-regulated protein 78; LC3: microtubule-associated protein 1 light chain 3; OGD/R: oxygen-glucose deprivation and reperfusion; p-eIF2α: phosphorylation of eIF2α; PERK: protein kinase RNA-like endoplasmic reticulum kinase.

References

    1. Abolhasanpour N, Alihosseini S, Golipourkhalili S, Badalzadeh R, Mahmoudi J, Hosseini L. Effect of melatonin on endoplasmic reticulum-mitochondrial crosstalk in stroke. Arch Med Res. 2021;52:673–682. - PubMed
    1. Allen CL, Bayraktutan U. Oxidative stress and its role in the pathogenesis of ischaemic stroke. Int J Stroke. 2009;4:461–470. - PubMed
    1. Avivar-Valderas A, Bobrovnikova-Marjon E, Alan Diehl J, Bardeesy N, Debnath J, Aguirre-Ghiso JA. Regulation of autophagy during ECM detachment is linked to a selective inhibition of mTORC1 by PERK. Oncogene. 2013;32:4932–4940. - PMC - PubMed
    1. Badiola N, Penas C, Miñano-Molina A, Barneda-Zahonero B, Fadó R, Sánchez-Opazo G, Comella JX, Sabriá J, Zhu C, Blomgren K, Casas C, Rodríguez-Alvarez J. Induction of ER stress in response to oxygen-glucose deprivation of cortical cultures involves the activation of the PERK and IRE-1 pathways and of caspase-12. Cell Death Dis. 2011;2:e149. - PMC - PubMed
    1. Chen X, Li LY, Jiang JL, Li K, Su ZB, Zhang FQ, Zhang WJ, Zhao GQ. Propofol elicits autophagy via endoplasmic reticulum stress and calcium exchange in C2C12 myoblast cell line. PLoS One. 2018;13:e0197934. - PMC - PubMed