. 2025 May 1;20(5):1495-1504.
doi: 10.4103/NRR.NRR-D-23-00493. Epub 2024 Mar 1.

Resting-state brain network remodeling after different nerve reconstruction surgeries: a functional magnetic resonance imaging study in brachial plexus injury rats

Affiliations

Resting-state brain network remodeling after different nerve reconstruction surgeries: a functional magnetic resonance imaging study in brachial plexus injury rats

Yunting Xiang et al. Neural Regen Res. .

Abstract

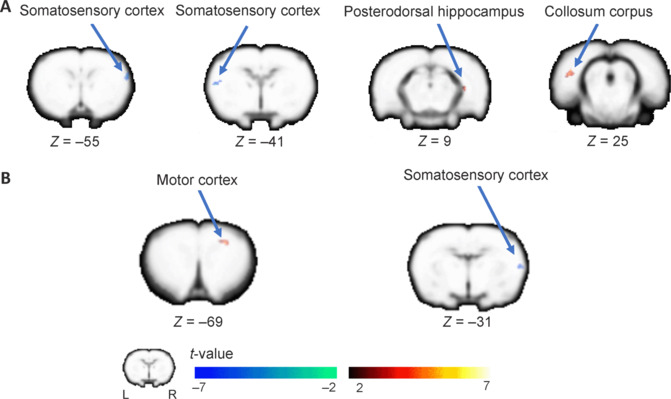
JOURNAL/nrgr/04.03/01300535-202505000-00031/figure1/v/2024-07-28T173839Z/r/image-tiff Distinct brain remodeling has been found after different nerve reconstruction strategies, including motor representation of the affected limb. However, differences among reconstruction strategies at the brain network level have not been elucidated. This study aimed to explore intra-network changes related to altered peripheral neural pathways after different nerve reconstruction surgeries, including nerve repair, end-to-end nerve transfer, and end-to-side nerve transfer. Sprague-Dawley rats underwent complete left brachial plexus transection and were divided into four equal groups of eight: no nerve repair, grafted nerve repair, phrenic nerve end-to-end transfer, and end-to-side transfer with a graft sutured to the anterior upper trunk. Resting-state brain functional magnetic resonance imaging was obtained 7 months after surgery. The independent component analysis algorithm was utilized to identify group-level network components of interest and extract resting-state functional connectivity values of each voxel within the component. Alterations in intra-network resting-state functional connectivity were compared among the groups. Target muscle reinnervation was assessed by behavioral observation (elbow flexion) and electromyography. The results showed that alterations in the sensorimotor and interoception networks were mostly related to changes in the peripheral neural pathway. Nerve repair was related to enhanced connectivity within the sensorimotor network, while end-to-side nerve transfer might be more beneficial for restoring control over the affected limb by the original motor representation. The thalamic-cortical pathway was enhanced within the interoception network after nerve repair and end-to-end nerve transfer. Brain areas related to cognition and emotion were enhanced after end-to-side nerve transfer. Our study revealed important brain networks related to different nerve reconstructions. These networks may be potential targets for enhancing motor recovery.


Conflict of interest statement

Conflicts of interest: The authors declare that they have no conflict of interest.

Figures

Figure 1
Figure 1
Spatial map of the sensorimotor network in the rats of all four groups (pooled). t-values (a statistic indicating the strength of brain activation in each voxel) are indicated on a color scale (color intensity ranges from 2 to 14, with higher values indicating higher t-values and stronger activity in a given voxel). Coordinates reference Z-axis coordinates of a stereotactic rat brain magnetic resonance imaging template, which has been aligned with the coordinates of Paxinos and Watson (1998). L: Left; R: right.
Figure 2
Figure 2
Spatial map of the interoceptive network in the rats of all four groups (pooled). t-values (a statistic indicating the strength of brain activation in each voxel) are indicated on a color scale (color intensity ranges from 2 to 12, with higher values indicating higher t-values and stronger activity in a given voxel). Coordinates reference Z-axis coordinates of a stereotactic rat brain magnetic resonance imaging template, which has been aligned with the coordinates of Paxinos and Watson (1998). L: Left; R: right.
Figure 3
Figure 3
Comparison of the sensorimotor network between the BPI + nerve repair and the two BPI + nerve transfer groups. Panel A represents the comparison between the BPI + nerve repair and BPI + end-to-end nerve transfer groups. Panel B represents the comparison between the BPI + nerve repair and BPI + end-to-side nerve transfer groups. t-values (a statistic indicating the strength of brain activity in each voxel) are indicated on a color scale (color intensity ranges from 2 to 7, with higher values indicating t-values and stronger activities in a given voxel). Warm tone represents that functional connectivity was higher in the BPI + nerve transfer groups after modeling. Cold tone represents that functional connectivity was lower in the BPI + nerve transfer groups. Coordinates reference Z-axis coordinates of a stereotactic rat brain magnetic resonance imaging template, which has been aligned with the coordinates of Paxinos and Watson (1998). BPI: Brachial plexus injury. L: Left; R: right.
Figure 4
Figure 4
Comparison of the sensorimotor network between the BPI + end-to-end nerve transfer and BPI + end-to-side nerve transfer groups. t-values (a statistic indicating the strength of brain activity in each voxel) are indicated on a color scale (color intensity ranges from 2 to 6, with higher values indicating t-values and stronger activities in a given voxel). Warm tone represents that functional connectivity was higher in the BPI + end-to-end transfer group after modeling. Cold tone represents that functional connectivity was lower in the BPI + end-to-end nerve transfer group. Coordinates reference Z-axis coordinates of a stereotactic rat brain magnetic resonance imaging template, which has been aligned with the coordinates of Paxinos and Watson (1998). BPI: Brachial plexus injury; L: left; R: right.
Figure 5
Figure 5
Comparison of the interoceptive network between the BPI + nerve repair and two BPI + nerve transfer groups. Panel A represents the comparison between the BPI + nerve repair and BPI + end-to-end nerve transfer group. Panel B represents the comparison between the BPI + nerve repair and BPI + end-to-side nerve transfer group. t-values (a statistic indicating the strength of brain activity in each voxel) are indicated on a color scale (color intensity ranges from 2 to 7, with higher values indicating t-values and stronger activities in a given voxel), Warm tone represents that functional connectivity was higher in the BPI + nerve transfer groups after modeling. Cold tone represents that functional connectivity was lower in the BPI + nerve transfer groups. Coordinates reference Z-axis coordinates of a stereotactic rat brain magnetic resonance imaging template, which has been aligned with the coordinates of Paxinos and Watson (1998). BPI: Brachial plexus injury; L: left; R: right.
Figure 6
Figure 6
Comparison of the interoceptive network between the BPI + end-to-end nerve transfer and BPI + end-to-side nerve transfer groups. t-values (a statistic indicating the strength of brain activity in each voxel) are indicated on a color scale (color intensity ranges from 2 to 5, with higher values indicating t-values and stronger activities in a given voxel). Warm tone represents that functional connectivity was higher in the BPI + end-to-end nerve transfer group after modeling. Cold tone represents that functional connectivity was lower in the BPI + end-to-end nerve transfer group. Coordinates reference Z-axis coordinates of a stereotactic rat brain magnetic resonance imaging template, which has been aligned with the coordinates of Paxinos and Watson (1998). BPI: Brachial plexus injury; L: left; R: right.

References

    1. Allgood JE, Bittner GD, Bushman JS. Repair and regeneration of peripheral nerve injuries that ablate branch points. Neural Regen Res. 2023;18:2564–2568. - PMC - PubMed
    1. Bajic D, Craig MM, Mongerson CRL, Borsook D, Becerra L. Identifying rodent resting-state brain networks with independent component analysis. Front Neurosci. 2017;11:685. - PMC - PubMed
    1. Becerra L, Pendse G, Chang PC, Bishop J, Borsook D. Robust reproducible resting state networks in the awake rodent brain. PLoS One. 2011;6:e25701. - PMC - PubMed
    1. Bellingacci L, Canonichesi J, Mancini A, Parnetti L, Di Filippo M. Cytokines, synaptic plasticity and network dynamics: a matter of balance. Neural Regen Res. 2023;18:2569–2572. - PMC - PubMed
    1. Bergmeister KD, Aman M, Muceli S, Vujaklija I, Manzano-Szalai K, Unger E, Byrne RA, Scheinecker C, Riedl O, Salminger S, Frommlet F, Borschel GH, Farina D, Aszmann OC. Peripheral nerve transfers change target muscle structure and function. Sci Adv. 2019;5:eaau2956. - PMC - PubMed

LinkOut - more resources