Current and Future Applications of Computational Fluid Dynamics in Coronary Artery Disease
- PMID: 39076179
- PMCID: PMC11269074
- DOI: 10.31083/j.rcm2311377
Current and Future Applications of Computational Fluid Dynamics in Coronary Artery Disease
Abstract
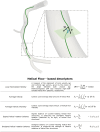
Hemodynamics interacts with the cellular components of human vessels, influencing function and healthy status. Locally acting hemodynamic forces have been associated-by a steadily increasing amount of scientific evidence-with nucleation and evolution of atherosclerotic plaques in several vascular regions, resulting in the formulation of the 'hemodynamic risk hypothesis' of the atherogenesis. At the level of coronary arteries, however, the complexity of both anatomy and physiology made the study of this vascular region particularly difficult for researchers. Developments in computational fluid dynamics (CFD) have recently allowed an accurate modelling of the intracoronary hemodynamics, thus offering physicians a unique tool for the investigation of this crucial human system by means of advanced mathematical simulations. The present review of CFD applications in coronary artery disease was set to concisely offer the medical reader the theoretical foundations of quantitative intravascular hemodynamics-reasoned schematically in the text in its basic (i.e., pressure and velocity) and derived quantities (e.g., fractional flow reserve, wall shear stress and helicity)-along with its current implications in clinical research. Moreover, attention was paid in classifying computational modelling derived from invasive and non-invasive imaging modalities with unbiased remarks on the advantages and limitations of each procedure. Finally, an extensive description-aided by explanatory figures and cross references to recent clinical findings-was presented on the role of near-wall hemodynamics, in terms of shear stress, and of intravascular flow complexity, in terms of helical flow.
Keywords: atherosclerosis; computational hemodynamics; computer model; computer simulation; coronary artery disease; helicity; virtual FFR; wall shear stress.
Copyright: © 2022 The Author(s). Published by IMR Press.
Conflict of interest statement
The author declares no conflict of interest. Fabrizio D’Ascenzo is serving as one of the Editorial Board members of this journal. We declare that Fabrizio D’Ascenzo had no involvement in the peer review of this article and has no access to information regarding its peer review. Full responsibility for the editorial process for this article was delegated to Jerome L. Fleg.
Figures


Similar articles
-
Modelling blood flow in coronary arteries: Newtonian or shear-thinning non-Newtonian rheology?Comput Methods Programs Biomed. 2023 Dec;242:107823. doi: 10.1016/j.cmpb.2023.107823. Epub 2023 Sep 19. Comput Methods Programs Biomed. 2023. PMID: 37757568
-
Haemodynamic assessment of human coronary arteries is affected by degree of freedom of artery movement.Comput Methods Biomech Biomed Engin. 2017 Feb;20(3):260-272. doi: 10.1080/10255842.2016.1215439. Epub 2016 Jul 28. Comput Methods Biomech Biomed Engin. 2017. PMID: 27467730
-
Modelling coronary flows: impact of differently measured inflow boundary conditions on vessel-specific computational hemodynamic profiles.Comput Methods Programs Biomed. 2022 Jun;221:106882. doi: 10.1016/j.cmpb.2022.106882. Epub 2022 May 13. Comput Methods Programs Biomed. 2022. PMID: 35597205
-
Coronary Computed Tomography Angiography Derived Fractional Flow Reserve and Plaque Stress.Curr Cardiovasc Imaging Rep. 2016;9:2. doi: 10.1007/s12410-015-9366-5. Epub 2016 Jan 5. Curr Cardiovasc Imaging Rep. 2016. PMID: 26941886 Free PMC article. Review.
-
Perspective on CFD studies of coronary artery disease lesions and hemodynamics: a review.Int J Numer Method Biomed Eng. 2014 Jun;30(6):659-80. doi: 10.1002/cnm.2625. Epub 2014 Jan 23. Int J Numer Method Biomed Eng. 2014. PMID: 24459034 Review.
Cited by
-
Advances in the Computational Assessment of Disturbed Coronary Flow and Wall Shear Stress: A Contemporary Review.J Am Heart Assoc. 2024 Oct;13(19):e037129. doi: 10.1161/JAHA.124.037129. Epub 2024 Sep 18. J Am Heart Assoc. 2024. PMID: 39291505 Free PMC article. Review.
-
An agent-based model of cardiac allograft vasculopathy: toward a better understanding of chronic rejection dynamics.Front Bioeng Biotechnol. 2023 Sep 12;11:1190409. doi: 10.3389/fbioe.2023.1190409. eCollection 2023. Front Bioeng Biotechnol. 2023. PMID: 37771577 Free PMC article.
-
Buckling critical pressures in collapsible tubes relevant for biomedical flows.Sci Rep. 2023 Jun 8;13(1):9298. doi: 10.1038/s41598-023-36513-6. Sci Rep. 2023. PMID: 37291334 Free PMC article.
-
In Silico, Patient-Specific Assessment of Local Hemodynamic Predictors and Neointimal Hyperplasia Localisation in an Arteriovenous Graft.Ann Biomed Eng. 2025 Jul;53(7):1575-1589. doi: 10.1007/s10439-025-03737-8. Epub 2025 May 7. Ann Biomed Eng. 2025. PMID: 40335792 Free PMC article.
-
Association Between Automated 3D Measurement of Coronary Luminal Narrowing and Risk of Future Myocardial Infarction.J Cardiovasc Transl Res. 2024 Aug;17(4):893-900. doi: 10.1007/s12265-024-10500-2. Epub 2024 Mar 1. J Cardiovasc Transl Res. 2024. PMID: 38427153 Free PMC article.
References
-
- Virmani R, Burke AP, Kolodgie FD, Farb A. Vulnerable plaque: the pathology of unstable coronary lesions. Journal of Interventional Cardiology . 2002;15:439–446. - PubMed
-
- Stone GW, Maehara A, Lansky AJ, de Bruyne B, Cristea E, Mintz GS, et al. A Prospective Natural-History Study of Coronary Atherosclerosis. New England Journal of Medicine . 2011;364:226–235. - PubMed
-
- Asakura T, Karino T. Flow patterns and spatial distribution of atherosclerotic lesions in human coronary arteries. Circulation Research . 1990;66:1045–1066. - PubMed
-
- Erlinge D, Maehara A, Ben-Yehuda O, Botker HE, Maeng M, Kjoller-Hansen L, et al. Identification of vulnerable plaques and patients by intracoronary near-infrared spectroscopy and ultrasound (PROSPECT II): a prospective natural history study. Lancet . 2021;397:985–995. - PubMed
Publication types
LinkOut - more resources
Full Text Sources
Miscellaneous

