. 2024 Jul 15:15:1416464.
doi: 10.3389/fimmu.2024.1416464. eCollection 2024.

Implications of disease-modifying therapies for multiple sclerosis on immune cells and response to COVID-19 vaccination

Affiliations

Implications of disease-modifying therapies for multiple sclerosis on immune cells and response to COVID-19 vaccination

Valeria Orrù et al. Front Immunol. .

Abstract

Introduction: Disease-modifying therapies (DMTs) have been shown to improve disease outcomes in multiple sclerosis (MS) patients. They may also impair the immune response to vaccines, including the SARS-CoV-2 vaccine. However, available data on both the intrinsic immune effects of DMTs and their influence on cellular response to the SARS-CoV-2 vaccine are still incomplete.

Methods: Here, we evaluated the immune cell effects of 3 DMTs on the response to mRNA SARS-CoV-2 vaccination by comparing MS patients treated with one specific therapy (fingolimod, dimethyl fumarate, or natalizumab) with both healthy controls and untreated patients. We profiled 23 B-cell traits, 57 T-cell traits, and 10 cytokines, both at basal level and after stimulation with a pool of SARS-CoV-2 spike peptides, in 79 MS patients, treated with DMTs or untreated, and 32 healthy controls. Measurements were made before vaccination and at three time points after immunization.

Results and discussion: MS patients treated with fingolimod showed the strongest immune cell dysregulation characterized by a reduction in all measured lymphocyte cell classes; the patients also had increased immune cell activation at baseline, accompanied by reduced specific immune cell response to the SARS-CoV-2 vaccine. Also, anti-spike specific B cells progressively increased over the three time points after vaccination, even when antibodies measured from the same samples instead showed a decline. Our findings demonstrate that repeated booster vaccinations in MS patients are crucial to overcoming the immune cell impairment caused by DMTs and achieving an immune response to the SARS-CoV-2 vaccine comparable to that of healthy controls.

Keywords: SARS-CoV-2; disease-modifying therapy; immune response; immune-phenotyping; multiple sclerosis.


Conflict of interest statement

The authors declare that the research was conducted in the absence of any commercial or financial relationships that could be construed as a potential conflict of interest. The author(s) declared that they were an editorial board member of Frontiers, at the time of submission. This had no impact on the peer review process and the final decision.

Figures

Figure 1
Figure 1
Stratification of MS patients based on therapy. The pie chart shows the percentage of each treatment used in the MS patients who participated in the study. ALEM, alemtuzumab (n.3); AZA, azathioprine (n.6); CLA, cladribine (n.1); DMF, dimethyl fumarate (n.39); FTY, fingolimod (n.46); GA, glatiramer acetate (n.5); IFN, interferon (n.11); NAT, natalizumab (n.24); OCR, ocrelizumab (n.19); RTX, rituximab (n.1); TER, teriflunomide (n.18); UNT, untreated (n.13).
Figure 2
Figure 2
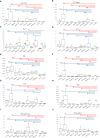
Immune characterization of MS patients stratified by therapy. Comparison of MS patients stratified by therapy to untreated patients and controls. Each boxplot graph represents a specific cell type expressed as cell count (cells/time, graphs A-C, L, P-S) or as cell frequency with respect to a hierarchically higher cell population (graphs D-K, M-O). The “x” within each box represents the average value, whereas the horizontal bar in each box indicates the median value. Graphs within the yellow box refer to FTY treatment, the blue box to DMF, and the red one to NAT- treated patients. P-values ranging from 0.05 to 1.08x10⁻⁴ are indicated with “*” and considered nominally significant; P-values below 1.08x10⁻⁴ are indicated with “**” and considered significant. See Methods for specifications about multiple test corrections.
Figure 3
Figure 3
Spike-specific B cells in MS patients vs controls at each time point. (A-E) Comparison of spike-specific B cell frequency at the four time points (from T0 to T3) in each MS group and healthy controls. P-values ranging from 0.05 to 8.33x10⁻³ are indicated with “*” and considered nominally significant; P-values below 8.33x10⁻³ are indicated with “**” and considered significant. (F-H) Comparison of spike-specific B cell frequency among the MS groups and healthy controls considering T1, T2, and T3 separately. (I) Comparison of spike B cell count among FTY-treated, untreated patients and controls at T3. (J) Comparison of spike B cell count among NAT-treated, untreated patients and controls at T3. P-values ranging from 0.05 to 1.19x10⁻³ are indicated with “*” and considered nominally significant; P-values below 1.19x10⁻³ are indicated with “**” and considered significant. (K) Comparison of anti-S antibodies between each MS group and controls at T3. P-values ranging from 0.05 to 1.25x10⁻² are indicated with “*” and considered nominally significant; P-values below 1.25x10⁻² are indicated with “**” and considered significant. See Methods for specifications about multiple test corrections.
Figure 4
Figure 4
Correlation among spike B cells and anti-S antibodies. (A-E) Stacked area graphs represent comparisons of anti-S and spike B cell count and frequency levels in each category. To use a unique scale, anti-S measurements (U/ml) have been divided by 1000. Legend for stacked area graphs is in (A). (F-T) Each boxplot represents the anti-S Abs expressed in U/ml (second row, F-J) and the corresponding spike B cells frequency (third row, K-O) and count expressed in number of cell/time (fourth row, P-T). Boxplots are color-coded as described in (F).
Figure 5
Figure 5
Lymphocyte activation following stimulation with Peptivator. (A–I) Boxplot graphs representing activated cell frequencies in MS patients stratified by therapy, untreated patients, and controls. Each group is represented at the basal level and following stimulation with Peptivator. Comparing basal or stimulated samples among groups, P-values ranging from 0.05 to 2.98x10⁻⁴ are indicated with “*” and considered nominally significant; P-values below 2.98x10⁻⁴ are indicated with “**” and considered significant. Comparing basal vs stimulated samples in the same group, P-values ranging from 0.05 to 4.16x10⁻³ are indicated with “*” and considered nominally significant; P-values below 4.16x10⁻³ are indicated with “**” and considered significant. See Methods for specifications about multiple test corrections. For simplicity, only asterisks related to comparisons between MS groups and controls are reported, whereas they are omitted for treated vs untreated MS patient comparisons. Asterisks are color-coded: in blue refer to basal level comparison, in red to comparisons of stimulated samples, and in green to basal vs stimulated comparisons in the same group.
Figure 6
Figure 6
Cytokine production following stimulation with Peptivator. (A–J) For each cytokine measured, boxplots of MS patients treated with FTY, DMF, NAT, or UNTR and healthy subjects are shown. Each boxplot graph represents a specific cytokine expressed as fluorescence intensity/cell (see Methods). Comparing basal or stimulated samples among groups, P-values ranging from 0.05 to 3.57x10⁻⁴ are indicated with “*” and considered nominally significant; P-values below 3.57x10⁻⁴ are indicated with “**” and considered significant. Asterisks are in blue for comparison at the basal level, and in red for comparison of stimulated samples. Comparing basal vs stimulated samples in the same group, P-values (colored in green) ranging from 0.05 to 0.005 are indicated with “*” and considered nominally significant; P-values below 0.005 are indicated with “**” and considered significant. As for Figure 4 , only asterisks related to comparisons among MS groups and controls are reported.
Figure 7
Figure 7
Study overview. Schematic workflow of the present study.

References

    1. Krajnc N, Hegen H, Traxler G, Leutmezer F, Di Pauli F, Kornek B, et al. . Humoral immune response to SARS-CoV-2 third vaccination in patients with multiple sclerosis and healthy controls: A prospective multicenter study. Mult Scler Relat Disord. (2022) 65:104009. doi: 10.1016/j.msard.2022.104009 - DOI - PMC - PubMed
    1. König M, Torgauten HM, Tran TT, Holmøy T, Vaage JT, Lund-Johansen F, et al. . Immunogenicity and safety of a third SARS-CoV-2 vaccine dose in patients with multiple sclerosis and weak immune response after COVID-19 vaccination. JAMA Neurol. (2022) 79:307–9. doi: 10.1001/jamaneurol.2021.5109 - DOI - PMC - PubMed
    1. Pitzalis M, Idda ML, Lodde V, Loizedda A, Lobina M, Zoledziewska M, et al. . Effect of different disease-modifying therapies on humoral response to BNT162b2 vaccine in sardinian multiple sclerosis patients. Front Immunol. (2021) 12:781843. doi: 10.3389/fimmu.2021.781843 - DOI - PMC - PubMed
    1. Idda ML, Pitzalis M, Lodde V, Loizedda A, Frau J, Lobina M, et al. . Cross-sectional analysis of the humoral response after SARS-CoV-2 vaccination in Sardinian multiple sclerosis patients, a follow-up study. Front Immunol. (2022) 13:946356. doi: 10.3389/fimmu.2022.946356 - DOI - PMC - PubMed
    1. Sainz de la Maza S, Walo-Delgado PE, Rodríguez-Domínguez M, Monreal E, Rodero-Romero A, Chico-García JL, et al. . Short- and long-term humoral and cellular immune responses to SARS-CoV-2 vaccination in patients with multiple sclerosis treated with disease-modifying therapies. Vaccines (Basel). (2023) 11:786. doi: 10.3390/vaccines11040786 - DOI - PMC - PubMed

MeSH terms

LinkOut - more resources