

A genetic and proteomic comparison of key AD biomarkers across tissues
- PMID: 39077866
- PMCID: PMC11633343
- DOI: 10.1002/alz.14139
A genetic and proteomic comparison of key AD biomarkers across tissues
Abstract
Introduction: Plasma has been proposed as an alternative to cerebrospinal fluid (CSF) for measuring Alzheimer's disease (AD) biomarkers, but no studies have analyzed in detail which biofluid is more informative for genetics studies of AD.
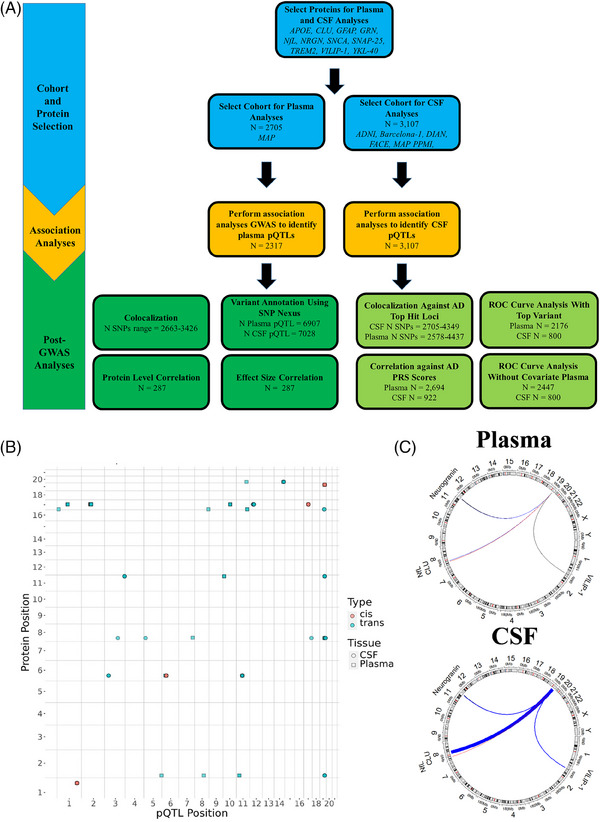
Method: Eleven proteins associated with AD (α-synuclein, apolipoprotein E [apoE], CLU, GFAP, GRN, NfL, NRGN, SNAP-25, TREM2, VILIP-1, YKL-40) were assessed in plasma (n = 2317) and CSF (n = 3107). Both plasma and CSF genome-wide association study (GWAS) analyses were performed for each protein, followed by functional annotation. Additional characterization for each biomarker included calculation of correlations and predictive power.
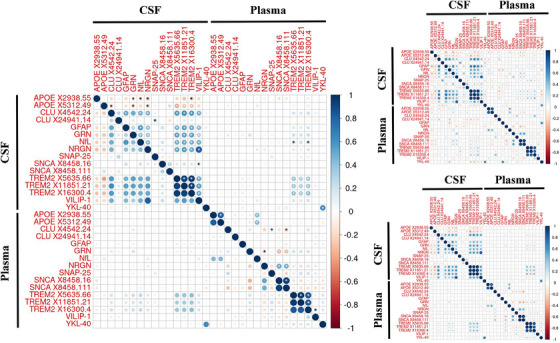
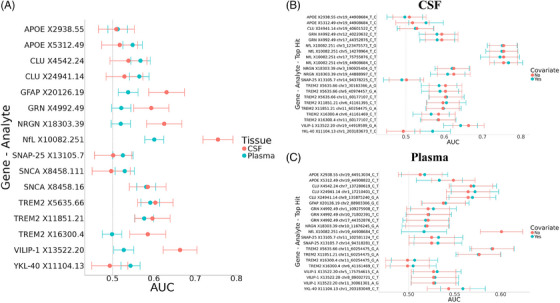
Results: Eighteen plasma protein quantitative train loci (pQTLs) associated with 10 proteins and 16 CSF pQTLs associated with 9 proteins were identified. Plasma and CSF shared some genetic loci, but protein levels between tissues correlated weakly. CSF protein levels better associated with AD compared to plasma.
Discussion: The present results indicate that CSF is more informative than plasma for genetic studies in AD.
Highlights: The identification of novel protein quantitative trait loci (pQTLs) in both plasma and cerebrospinal fluid (CSF). Plasma and CSF levels of neurodegeneration-related proteins correlated weakly. CSF is more informative than plasma for genetic studies of Alzheimer's disease (AD). Neurofilament light (NfL), triggering receptor expressed on myeloid cells 2 (TREM2), and chitinase-3-like protein 1 (YKL-40) tend to show relatively strong inter-tissue associations. A novel signal in the apolipoprotein E (APOE) region was identified, which is an eQTL for APOC1.
Keywords: Alzheimer's disease; CSF; biomarkers; genomics; neurodegenerative disease; plasma; protein quantitative trait loci.
© 2024 The Author(s). Alzheimer's & Dementia published by Wiley Periodicals LLC on behalf of Alzheimer's Association.
Conflict of interest statement
Figures
References
-
- Simrén J, Elmgren A, Blennow K, Zetterberg H. Chapter six—fluid biomarkers in Alzheimer's disease. Adv Clin Chem. 2023:249‐281. - PubMed
Publication types
MeSH terms
Substances
Grants and funding
- 73305095007/ZONMW_/ZonMw/Netherlands
- P01 AG003991/AG/NIA NIH HHS/United States
- Araclon Biotech
- EB/NIBIB NIH HHS/United States
- 101034344/EPND
- Fonds de Recherche du Québec Santé
- P30 AG066444/AG/NIA NIH HHS/United States
- P01AG026276/NH/NIH HHS/United States
- Health∼Holland
- Alzheimer Nederland
- EuroImmun
- Biogen
- P30 AG066515/NH/NIH HHS/United States
- Michael J. Fox Foundation
- Gieskes-Strijbisfonds
- 831434/European Commission
- U01 AG058922/AG/NIA NIH HHS/United States
- R01 AG044546/AG/NIA NIH HHS/United States
- Servier
- P30 AG066515/AG/NIA NIH HHS/United States
- RF1 AG053303/AG/NIA NIH HHS/United States
- Lumosity
- U01 AG024904/AG/NIA NIH HHS/United States
- Bristol-Myers Squibb Company
- LI- W81XWH2010849/Department of Defense
- Janssen Alzheimer Immunotherapy Research and Development, LLC
- Piramal Imaging
- W81XWH-12-2-0012/Alzheimer's Disease Neuroimaging Initiative
- 831434/Innovative Medicines Initiatives 3TR
- RF1AG074007/NH/NIH HHS/United States
- P01AG03991/GlaxoSmithKline
- RF1 AG058501/AG/NIA NIH HHS/United States
- P01 AG026276/AG/NIA NIH HHS/United States
- NR170065/Selfridges Group Foundation
- LSHM20106/Topsector Life Sciences & Health
- Merck & Co. Inc.
- Novartis Pharmaceuticals Corporation
- PID2020-115613RA-I00/Ministerio Español de Ciencia e innovación
- RF1AG053303/NH/NIH HHS/United States
- GE Healthcare
- R00AG062723/NH/NIH HHS/United States
- 2018-T2/BMD-14885/Comunidad de Maddrid
- Brain Canada Foundation
- Elan Pharmaceuticals Inc.
- P01AG026276/GlaxoSmithKline
- RF1 AG074007/AG/NIA NIH HHS/United States
- A2021033S/Bright Focus Foundation
- AbbVie
- ZEN-22-848604/Alzheimer's Association Zenith Fellows Award
- Johnson & Johnson Pharmaceutical Research and Development, LLC.
- Transition Therapeutics
- R00 AG062723/AG/NIA NIH HHS/United States
- RF1AG058501/NH/NIH HHS/United States
- 860197/European Commission
- F. Hoffman-La Roche Ltd
- Takeda Pharmaceutical Compant
- Alzheimer Drug Discovery Foundation
- WashU Departments of Neurology and Psychiatry
- R01AG044546/NH/NIH HHS/United States
- Pfizer Inc.
- Chan Zuckerberg Initiative
- P01AG003991/NH/NIH HHS/United States
- P30AG066444/NH/NIH HHS/United States
- Eli Lilly and Company
- P30AG066444/GlaxoSmithKline
- CereSpir Inc.
- IXICO Ltd.
- NeuroRx Research
- U19AG032438/Dominantly Inherited Alzheimer Network
- BioClinica Inc.
- SG-20-690363/ALZ/Alzheimer's Association/United States
- U01AG058922/NH/NIH HHS/United States
- Meso Scale Diagnostics LLC
- Neurotrack Technologies
- Fujirebio
- Lundbeck
- Genentech Inc.
- U19 AG032438/AG/NIA NIH HHS/United States
- Eisai Inc.
LinkOut - more resources
Full Text Sources
Medical
Research Materials
Miscellaneous
