. 2024 Oct 1;30(19):4464-4481.
doi: 10.1158/1078-0432.CCR-24-1317.

Pharmacologic Inhibition of EIF4A Blocks NRF2 Synthesis to Prevent Osteosarcoma Metastasis

Affiliations

Pharmacologic Inhibition of EIF4A Blocks NRF2 Synthesis to Prevent Osteosarcoma Metastasis

Michael M Lizardo et al. Clin Cancer Res. .

Abstract

Purpose: Effective therapies for metastatic osteosarcoma (OS) remain a critical unmet need. Targeting mRNA translation in metastatic OS offers a promising option, as selective translation drives the synthesis of cytoprotective proteins under harsh microenvironmental conditions to facilitate metastatic competence.

Experimental design: We assessed the expression levels of eukaryotic translation factors in OS, revealing the high expression of the eukaryotic initiation factor 4A1 (EIF4A1). Using a panel of metastatic OS cell lines and patient-derived xenograft (PDX) models, EIF4A1 inhibitors were evaluated for their ability to block proliferation and reduce survival under oxidative stress, mimicking harsh conditions of the lung microenvironment. Inhibitors were also evaluated for their antimetastatic activity using the ex vivo pulmonary metastasis assay and in vivo metastasis models. Proteomics was performed to catalog which cytoprotective proteins or pathways were affected by EIF4A1 inhibition.

Results: CR-1-31B, a rocaglate-based EIF4A1 inhibitor, exhibited nanomolar cytotoxicity against all metastatic OS models tested. CR-1-31B exacerbated oxidative stress and apoptosis when OS cells were co-treated with tert-butylhydroquinone, a chemical oxidative stress inducer. CR-1-31B potently inhibited OS growth in the pulmonary metastasis assay model and in experimental and spontaneous models of OS lung metastasis. Proteomic analysis revealed that tert-butylhydroquinone-mediated upregulation of the NRF2 antioxidant factor was blocked by co-treatment with CR-1-31B. Genetic inactivation of NRF2 phenocopied the antimetastatic activity of CR-1-31B. Finally, the clinical-grade EIF4A1 phase-1-to-2 inhibitor, zotatifin, similarly blocked NRF2 synthesis and the OS metastatic phenotype.

Conclusions: Collectively, our data reveal that pharmacologic targeting of EIF4A1 is highly effective in blocking OS metastasis by blunting the NRF2 antioxidant response.


Conflict of interest statement

M.M. Lizardo reports nonfinancial support from eFFECTOR Therapeutics during the conduct of the study. E. Sweet-Cordero reports grants from NCI during the conduct of the study. No disclosures were reported by the other authors.

Figures
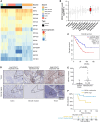
Figure 1.
Figure 1.
Expression of mRNA translation factors in OS. A, Heatmap of a subset of mRNA translation factor transcript levels from datasets of patients with OS: A. Sweet-Cordero’s group (patient, PDX, cell lines), Buddingh cohort of patients (budd), Dai dataset from OS PDX models (dai), and normal patient bone marrow cells (amb). B, Survey of transcript levels of EIF4A1 across different types of cancers. C, High transcript levels of EIF4A1 are associated with poorer outcome in patients with sarcoma compared with patients with low transcript levels [The Cancer Genome Atlas (TCGA): sarcoma (SARC) data, Gene Expression Profiling Interactive Analysis 2]. D, Evaluation of EIF4A1 protein levels via IHC in samples of human patient with OS and normal tissue controls. Scale bar, 200 μm. E, H-scores of EIF4A1 staining were compared between normal tissue (n = 26) and tumor tissue (n = 21) via Mann–Whitney U test, where P < 0.001. F, The level of EIF4A1 expression correlates with patient overall survival; log-rank test, P < 0.05.
Figure 2.
Figure 2.
Single-agent activity of CR-1-31B in ex vivo and in vivo OS metastasis models. A, MG63.3 paraosseous (right hind leg gastrocnemius) primary leg tumor growth curves in response to vehicle or CR-1-31B (0.2 mg/kg) treatment (n = 10 per group). Tumor volumes were compared between vehicle and CR-1-31B treatment groups at 44 days after injection via Mann–Whitney U test, P < 0.05. B, Fold changes in mouse body weights are shown for the primary tumor growth experiment. C, Kaplan–Meier survival curves for vehicle and CR-1-31B–treated groups compared via log-rank test, n = 10 per group, P < 0.0001. D, Representative MG63.3 anti-eGFP IHC staining of experimental (i.v. injection) lung metastases in vehicle and CR-1-31B treatment groups (n = 12 per group) at 21 days after injection. E, Number of MG63.3 lung metastases in vehicle and CR-1-31B groups was compared by an unpaired t test, P < 0.0001. F, Representative MNNG anti-eGFP IHC staining of spontaneous lung metastases from vehicle and CR-1-31B–treated groups. Scale bar, 5 mm. G, Spontaneous lung metastases from orthotopic MNNG tumor–bearing mice were enumerated and compared via an unpaired t test, n = 9 per group, P < 0.05. H, PuMA lung slices containing eGFP-expressing MNNG OS cells are shown for both DMSO and 2 nmol/L CR-1-1B–treated groups over time. I, Quantification of PuMA lung tumor burden from fluorescence image data. Mean lung tumor burdens were compared by Mann–Whitney U test, where the P value is indicated on the graph; n = 8 for both groups.
Figure 3.
Figure 3.
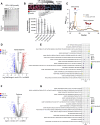
CR-1-31B treatment affects global translation in OS cells. A, SUrface SEnsing of Translation Western blot of puromycylated protein levels in MG63.3 cells in response to increasing concentrations of CR-1-31B. B, Top, in situ immunofluorescence staining of puromycylated proteins (stained with anti-puro-Alexa 594 antibodies) in MG63.3 cells treated with DMSO, 2 and 4 nmol/L CR-1-31B (top row); 8 and 16 nmol/L CR-1-31B, and 10 μmol/L CHX as a positive control for translation inhibition; images show merged Alexa 594 and DAPI (nuclei) images per condition. Bottom, fluorescent intensity measurements from each group were compared via Kruskal–Wallis (P < 0.0001) and post hoc pairwise Dunn multiple comparisons test (P values shown on graph, right). C, An example of a polysome profile of MG63.3 cells treated with 4 nmol/L CR-1-31B vs. DMSO for 24 hours. D, Volcano plot of transcriptomic fold changes (4 nmol/L CR-1-31B vs. DMSO) in MG63.3 cells. Significance cutoff value = 3, and fold changes less than −1 (blue) and greater than 1 (red). E, Bubble chart summarizing several redox/stress-related gene sets from the GSEA of total mRNA of MG63.3 cells treated with 4 nmol/L CR-1-31B vs. vehicle control. Pathways are shown in the y-axis; normalized enrichment score (NES) is shown in the x-axis. The gene count observed for each pathway is represented by dot size; significance [−log10 (adjusted P value)] is coded by color. F, Volcano plot of the proteomic changes (4 nmol/L CR-1-31B vs. DMSO) in MG63.3 cells. Significance cutoff value = 1.3, and fold changes less than −1 (blue) and greater than 1 (red). G, Bubble chart summarizing the redox/stress-related gene sets from GSEA performed on the proteomic data.
Figure 4.
Figure 4.
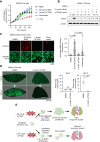
CR-1-31B modulates the antioxidant response in metastatic OS cells. A, Metastatic OS cell two-dimensional proliferation of MG63.3 cells, MNNG cells, and PDX OS742 cell line model (right). At the endpoint, experimental groups for all three cell lines were compared via Kruskal–Wallis test and post hoc Dunn multiple comparisons test where P values are indicated. The data are representative of three biological replicates. B, Percent tumor spheroid death in MG63.3, MNNG, and OS742. Representative micrographs of tumor spheroids are shown. Scale bar, 200 μm. The quantification of SYTOX Orange staining (gray graphs) are shown; groups were compared using either ANOVA (P < 0.0001) or Kruskal–Wallis, and corresponding post hoc Tukey or Dunnett multiple comparisons tests were used for pairwise analyses (see indicated P values). C, A mammalian expression vector encoding destabilized mCherry protein and driven by AREs was constructed and transfected into eGFP-expressing MG63.3 and MNNG cells. D, Example of mCherry expression in response to MG63.3 cells treated with either DMSO or tBHQ. E, Western blot for NRF2, NQO1, mCherry, and β-actin protein levels in MG63.3 cells in response to single agent 75 μmol/L tBHQ over time. F, Live-cell imaging of MG63.3-ARE-mCherry cells (above) in response to treatment to vehicle, tBHQ alone, CR-1-31B alone, or tBHQ + CR-1-31B. Scale bar, 100 μm. Experimental groups were compared via Kruskal–Wallis (P < 0.0001), where post hoc Dunn multiple comparisons tests were used in pairwise comparisons (P values indicated on graph). The number of cells analyzed per conditions ranged from 450 to 1,254. G, Western blot of MG63.3 cells expressing NRF2, NQO1, mCherry, and β-actin in the presence of DMSO, 75 μmol/L tBHQ alone, 4 nmol/L CR-1-31B alone, and 75 μmol/L tBHQ + 4 nmol/L CR-1-31B at 48 hours of treatment. (C, Created with BioRender.com.)
Figure 5.
Figure 5.
Effects of CR-1-31B on NRF2 protein levels in OS cells under oxidative stress. A, Proteomic heatmap showing the top 10 proteins being upregulated with tBHQ (1-hour) treatment but downregulated with CR-1-31B co-treatment (24 hours pretreatment). B, Western blot validation of NRF2 protein levels at the indicated experimental condition. Numbers represent fold change in densitometry over the first lane for NRF2. C, RT-PCR of NFE2L2 transcript (normalized to GAPDH) levels under similar experimental conditions; average of three technical replicates are shown. D, Graph showing changes in NRF2 protein densitometry measurements over time in a CHX chase assay. E, Schematic diagram of how AHA and “Click” chemistry with biotin alkenes was used to label acutely translated proteins under oxidative stress. F, Western blot of streptavidin Dynabeads-enriched biotinylated proteins under various conditions: DMSO, 75 μmol/L tBHQ (1 hour), 2 and 4 nmol/L CR-1-31B (24 hours treatment), 75 mol/L tBHQ + 2 nmol/L CR-1-31B. A Ponceau Red stain of the membrane is also shown. G, Samples from this enriched pool of biotinylated proteins were probed with anti-NRF2 antibodies and anti-β-actin antibodies. H, Densitometry showing normalized NRF2 protein levels (NRF2/β-actin densitometry ratio) for each indicated experimental condition. (E, Created with BioRender.com.)
Figure 6.
Figure 6.
The clinical-grade EIF4A1/2 inhibitor eFT226 (zotatifin) inhibits the oxidative stress response and metastatic capacity in MG63.3 OS cells. A, eFT226 inhibits the proliferation of MG63.3 cells under oxidative stress; n = 4 per time point. DMSO and combination were compared via Mann–Whitney U test, where significance is indicated. B, Western blot of NRF2 protein expression in MG63.3 cells with 1-hour tBHQ treatment +/− increasing doses of eFT226. Numbers represent fold change in densitometry over the first lane for NRF2. C, Representative fluorescence microscopy images of MG63.3 cells expressing the ARE-mCherry reporter under 24 hours tBHQ treatment +/− 24 hours pretreatment with eFT226, top. Quantification of fluorescence in MG63.3 cells expressing the ARE-mCherry reporter (normalized to eGFP) under 24 hours tBHQ treatment +/− 24 hours pretreatment with eFT226; the number of cells measured per condition ranged from 309 to 558 cells. D, eFT226 effects on the growth of MG63.3 cells in the PuMA model. Lung tumor burden is shown in DMSO and eFT226 groups at day 0 (top panels) and at day 14 after injection (bottom panels). Quantification of fluorescence image data from day 0 and 14 is shown in the graphs, right, where n = 8 per group and day 0 comparisons were made using an unpaired t test (P value indicated on graph); and Mann–Whitney U test was used to compare results at day 14 (P value indicated on graph). Scale bar, 0.5 mm. E, A diagram of a working model of how CR-1-31B/eFT226 prevents metastatic OS cells from growing in the lung microenvironment. (E, Created with BioRender.com.)

References

    1. Smrke A, Anderson PM, Gulia A, Gennatas S, Huang PH, Jones RL. Future directions in the treatment of osteosarcoma. Cells 2021;10:172. - PMC - PubMed
    1. Belayneh R, Fourman MS, Bhogal S, Weiss KR. Update on osteosarcoma. Curr Oncol Rep 2021;23:71. - PubMed
    1. Koshkina N, Yang Y, Kleinerman ES. The Fas/FasL signaling pathway: its role in the metastatic process and as a target for treating osteosarcoma lung metastases. In: Kleinerman ES, Gorlick R, editors. Current Advances in the Science of Osteosarcoma: Research Perspectives: Tumor Biology, Organ Microenvironment, Potential New Therapeutic Targets, and Canine Models. Cham: Springer International Publishing; 2020. pp. 177–87.
    1. Weiss L, Mayhew E, Rapp DG, Holmes JC. Metastatic inefficiency in mice bearing B16 melanomas. Br J Cancer 1982;45:44–53. - PMC - PubMed
    1. Eyles J, Puaux A-L, Wang X, Toh B, Prakash C, Hong M, et al. . Tumor cells disseminate early, but immunosurveillance limits metastatic outgrowth, in a mouse model of melanoma. J Clin Invest 2010;120:2030–9. - PMC - PubMed

MeSH terms

Substances