

Gut Microbial Changes Associated With Obesity in Youth With Type 1 Diabetes
- PMID: 39078977
- PMCID: PMC11747672
- DOI: 10.1210/clinem/dgae529
Gut Microbial Changes Associated With Obesity in Youth With Type 1 Diabetes
Abstract
Context: Obesity is prevalent in type 1 diabetes (T1D) and is problematic with higher risk for diabetes complications. It is unknown to what extent gut microbiome changes are associated with obesity and T1D.
Objective: This work aimed to describe the gut microbiome and microbial metabolite changes associated with obesity in T1D. We hypothesized statistically significant gut microbial and metabolite differences in lean T1D youth (body mass index [BMI]: 5%-<85%) vs those with obesity (BMI: ≥95%).
Methods: We analyzed stool samples for gut microbial (using metagenomic shotgun sequencing) and short-chain fatty acid (SCFA) differences in lean (n = 27) and obese (n = 21) T1D youth in a pilot study. The mean ± SD age was 15.3 ± 2.2 years, glycated hemoglobin A1c 7.8 ± 1.3%, diabetes duration 5.1 ± 4.4 years, 42.0% female, and 94.0% were White.
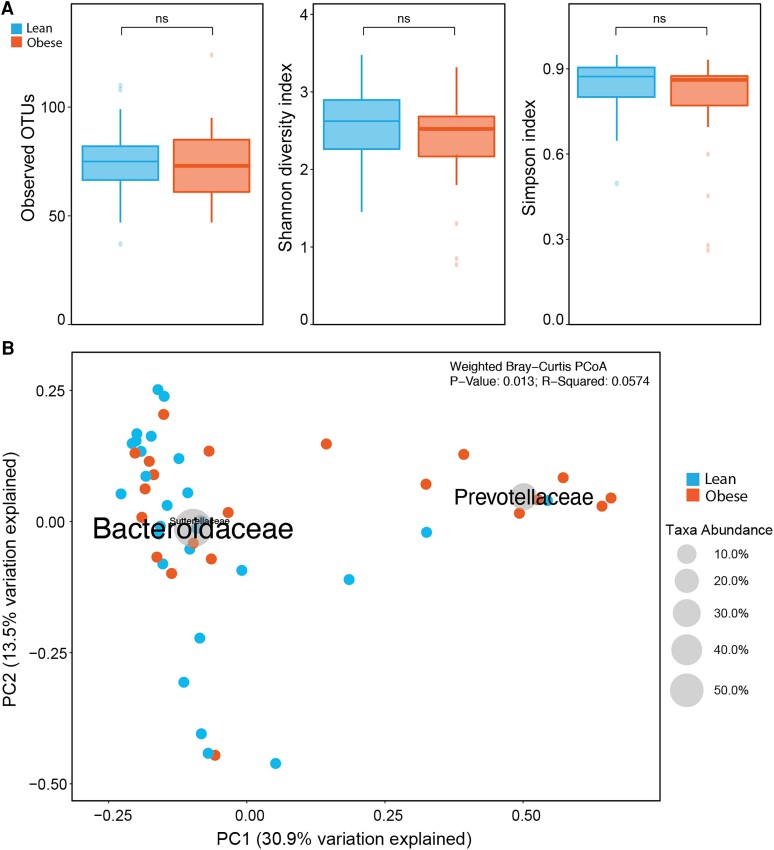
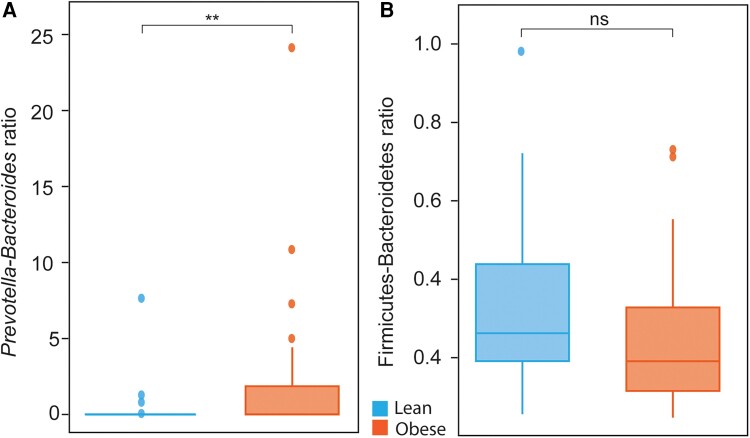
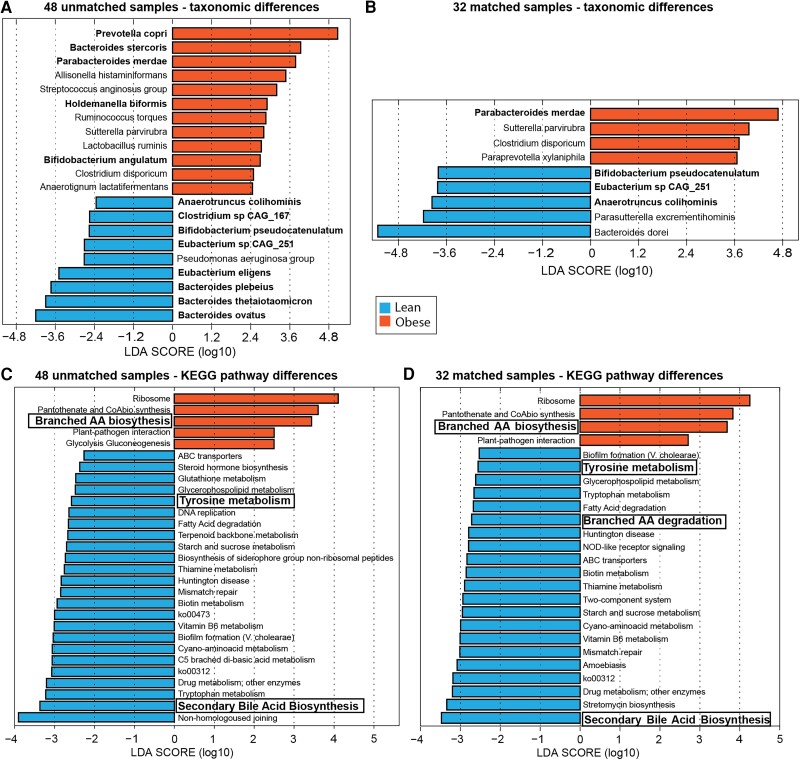
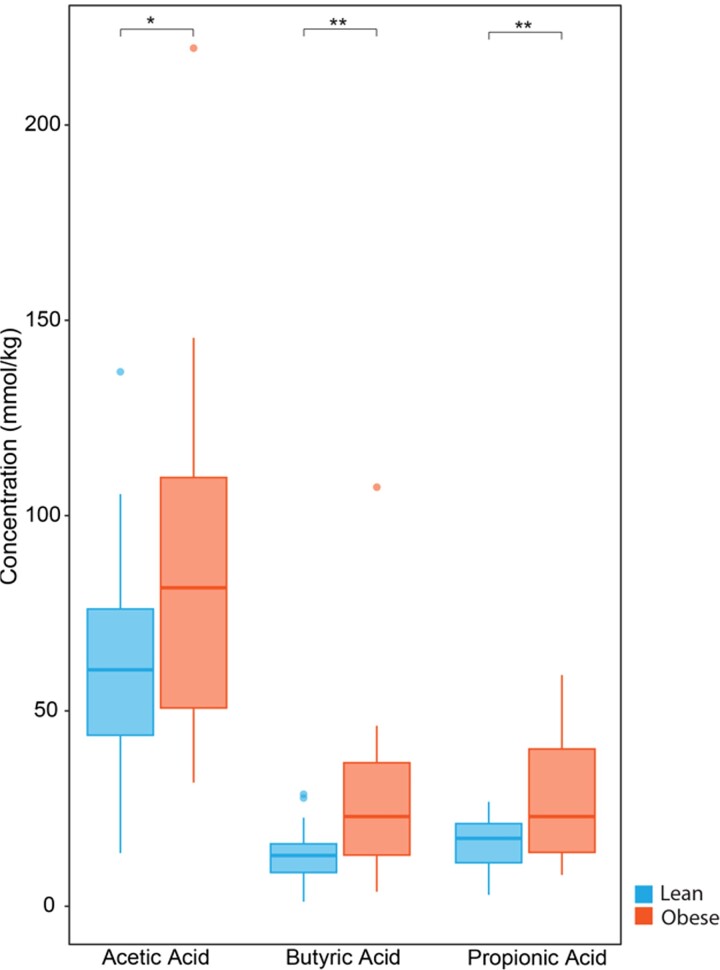
Results: Bacterial community composition showed between sample diversity differences (β-diversity) by BMI group (P = .013). There was a higher ratio of Prevotella to Bacteroides in the obese group (P = .0058). There was a differential distribution of significantly abundant taxa in either the lean or obese groups, including increased relative abundance of Prevotella copri, among other taxa in the obese group. Functional profiling showed an upregulation of branched-chain amino acid (BCAA) biosynthesis in the obese group and upregulation of BCAA degradation, tyrosine metabolism, and secondary bile acid biosynthesis in the lean group. Stool SCFAs were higher in the obese vs the lean group (P < .05 for all).
Conclusion: Our findings identify a gut microbiome and microbial metabolite signature associated with obesity in T1D. These findings could help identify gut microbiome-targeted therapies to manage obesity in T1D.
Keywords: Prevotella; microbiome; obesity; secondary bile acids; short chain fatty acids; type 1 diabetes.
© The Author(s) 2024. Published by Oxford University Press on behalf of the Endocrine Society.
Figures
Update of
-
Gut microbial changes associated with obesity in youth with type 1 diabetes.medRxiv [Preprint]. 2023 Dec 1:2023.12.01.23299251. doi: 10.1101/2023.12.01.23299251. medRxiv. 2023. Update in: J Clin Endocrinol Metab. 2025 Jan 21;110(2):364-373. doi: 10.1210/clinem/dgae529. PMID: 38076970 Free PMC article. Updated. Preprint.
References
-
- Redondo MJ, Foster NC, Libman IM, et al. Prevalence of cardiovascular risk factors in youth with type 1 diabetes and elevated body mass index. Acta Diabetol. 2016;53(2):271‐277. - PubMed
-
- Diabetes Control and Complications Trial/Epidemiology of Diabetes Interventions and Complications (DCCT/EDIC) Research Group; Nathan DM, Zinman B, et al. Modern-day clinical course of type 1 diabetes mellitus after 30 years’ duration: the diabetes control and complications trial/epidemiology of diabetes interventions and complications and Pittsburgh epidemiology of diabetes complications experience (1983–2005). Arch Intern Med. 2009;169(14):1307‐1316. - PMC - PubMed
MeSH terms
Substances
Grants and funding
LinkOut - more resources
Full Text Sources
Medical
